Editor’s Note: This article was republished with permission from Peak Prosperity.
Growing up as I did in coastal New England, this old rhyme was drilled into us as children:
Red sky at night, sailor’s delight;
Red sky at morning, sailor take warning.
Because many of the people in town still made their living on the sea, the safety of person and property depended on being able to recognize the signs of approaching danger.
A notably red sky at morning is usually due to sunrise reflection off of moisture-bearing clouds, signifying an arriving a storm system bringing rain, wind and rough seas. Those who ignored a red sky warning often did so at their peril.
Red Sky In The Markets
I’m reminded of that childhood rhyme because the markets are giving us a clear “red sky” warning right now. One that comes after (too) many years of uninterrupted fair winds and smooth sailing.
The markets plunged nearly 8% in a single week. And the losses were across the board. Nearly every asset class from stocks to bonds to commodities to real estate are participating in the pain. Market displays are a sea of red.
We’ve written so often and recently of the dangerous level of over-valuation in asset prices (caused by years of central bank intervention) that to re-hash the premise again feels unnecessary.
But the chart below is worth our attention now, as it really drives home just how dangerously over-extended the markets have become. It’s a 20-year chart of the S&P 500, showing how it has traded vs its 50-month moving average (the thin green line).
Importantly, the chart also plots the Bollinger bands for this moving average. These are the thin red (upper) and purple (lower) lines above and below the green one.
The simple definition of Bollinger bands is that they are measurements of volatility, and serve as indicators of “highness” or “lowness” of price relative to trading history (a more complex explanation can be found here).
What that means is, when the price of the S&P 500 trades near the upper (red) Bollinger band, that’s an indication it’s over-priced vs its historic trading behavior. And vice-versa when it trades near the lower (purple) band.
Now, the chart below is important because it shows that over the past 20-years, the S&P 500 has *never* traded above the its 50-month upper Bollinger band — EXCEPT for the 7 months preceding this one. Simply put, the market had not been more overvalued in (at least) the past 20 years as it was last month:![]()
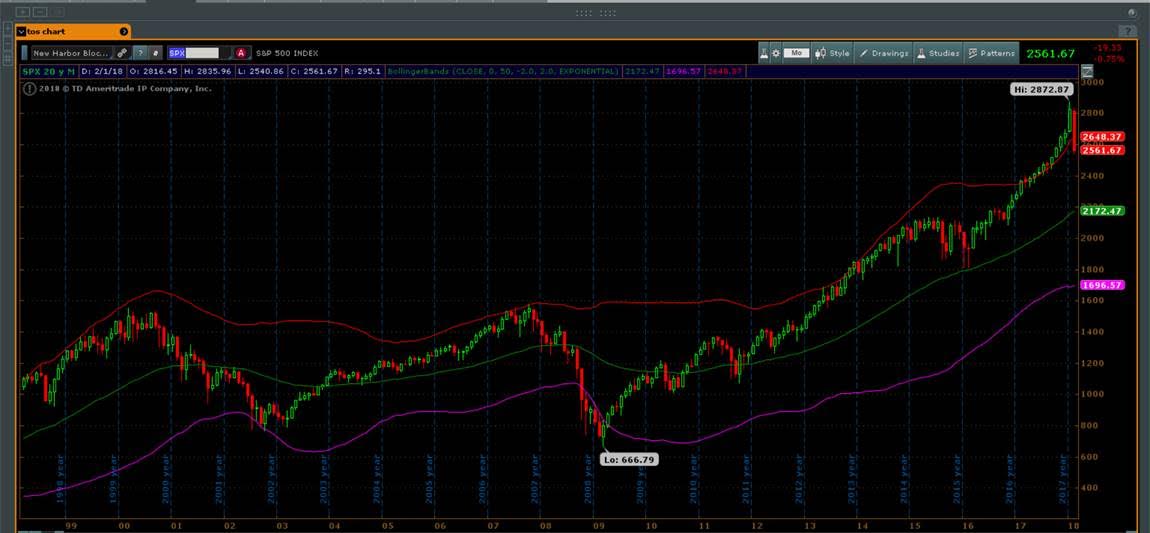
But just as frightening, though, is how the 7% drop the S&P has experienced over the past week has only brought it back to just touch the upper Bollinger band. Despite its recent losses, the S&P is still wildly over-valued.
Said another way: it still has further to fall. A LOT further.
If indeed this is the start of a major correction, one that clears out all “excessive exuberance” as happened in 2001 and 2008, we could well see a retracement down past the 50-month moving average, all the way to (and possibly, briefly, below) the lower Bollinger band.
That would put the S&P somewhere around 1,500-1,600 — a drop of around 40% from where it closed today.
And as we made the case earlier this week when looking at classic asset price bubble curves, a return of the S&P to a price level below 1,000 can’t be ruled out.
Time To Batten Down The Hatches
When a storm arrives at sea, sailors hunker down. They strip, tie fast, and stow everything they can — then they ride out the storm and re-emerge once it has passed.
