Is the Fed’s Rate Hike Plan Too Aggressive?
At the beginning of the year, most expectations were for three quarter-point hikes from the Fed during 2018 with an outside shot at a fourth. Right now, the Fed futures market is telling us that a third hike later this year is virtually guaranteed, and there’s a 58% chance of hikes in both September and December. But is that a good thing?
It was anticipated that rates on the long end of the curve would continue their slow ascent throughout the year. That was the case in much of the first half, but now the Fed might want to think twice now that long-term Treasury rates have started to come back down. The current data – inflation, job growth, GDP – all support further rate hikes, but raising rates amid concerns over slowing global GDP growth could grind the economy closer to a zero growth environment.
It’s a delicate balancing act for which there’s no good answer. A hike in September seems like a done deal, but the next few months could be key in determining if the Fed is ready to pull the trigger for a fourth time. I’m leaning towards believing the Fed will not raise in December, but there’s a lot of time for things to change.
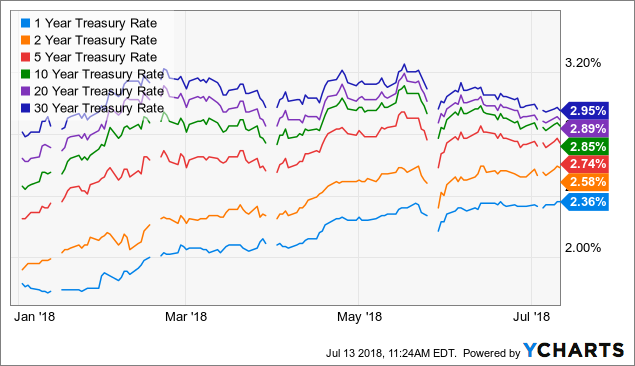
The Treasury Curve Gets Flatter and Flatter
The spread between different Treasury maturities has gotten to the point where there’s almost no yield advantage to venturing into long-term securities.
![]()
Investors have been nervous about committing assets to riskier investments so far in 2018. Using the iShares Treasury ETFs (SHY) (IEI) (IEF) (TLH) (TLT) as proxies, we’ve seen money flowing into government notes across virtually all maturities.

ETFs focused on short maturities and durations, in particular, have attracted money. The iShares Floating Rate Bond ETF (FLOT) and the iShares Short Treasury Bond ETF (SHV) have brought in more than $10 billion in new money combined so far in 2018.
I’m going to post this chart one more time since I think it bears repeating. Each one of the last five recessions has been preceded by an inversion of the yield curve. We’re getting awfully close to it inverting again as the 10-2 Year Treasury spread is at its lowest level since before the financial crisis.
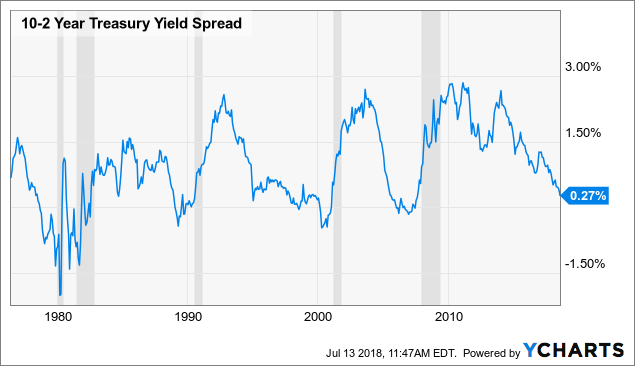
Those gray bars are recessionary periods. As mentioned earlier, this isn’t a sign of imminent disaster, but it’s a warning sign that trouble could be on the way as early as 2019.
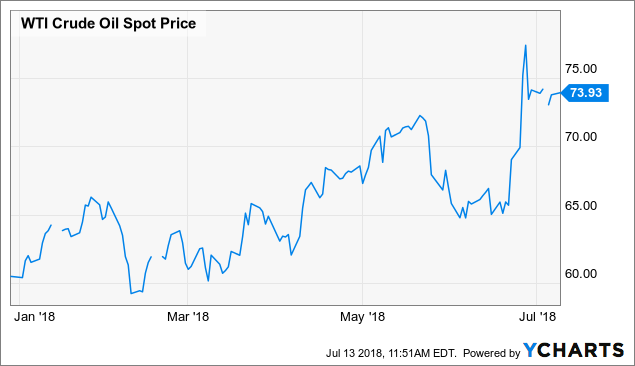
Oil Prices Getting Whipsawed
After languishing below $50 a barrel as recently as one year ago, WTI crude finally enjoyed a sustained that had the price about the $70 mark multiple times in 2018. The price of oil, however, has been incredibly unstable. The news of the day, whether it’s OPEC production cut agreements, inventory levels or concerns over production levels in Iran and Libya, the price of oil remains volatile, which makes judging the future path of oil and energy ETFs a challenge.
$70 oil makes it profitable for oil companies to produce, especially after they trimmed things back in order to handle oil prices in the $50 range not too long ago. Oil prices have doubled since the beginning of 2016, but oil and energy ETFs, for the most part, have struggled to gain.
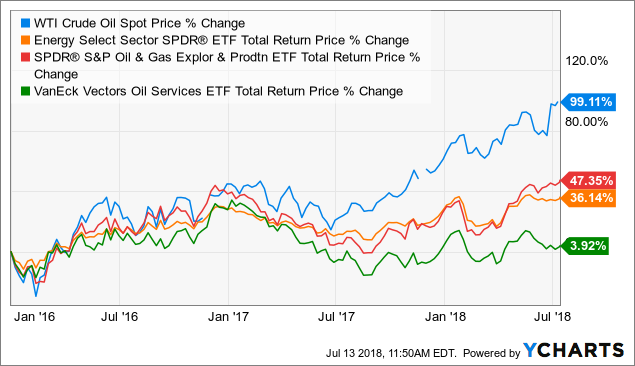
The energy sector has been the market’s third-best performing group, so it’s not like it’s underperformed this year, but certain segments have done better than others. The VanEck Vectors Oil Services ETF (OIH) was my top energy pick at the beginning of the year, and while it looked good for much of the first half, it’s given back much of its 2018 gains as it suffers from the volatility of oil prices.
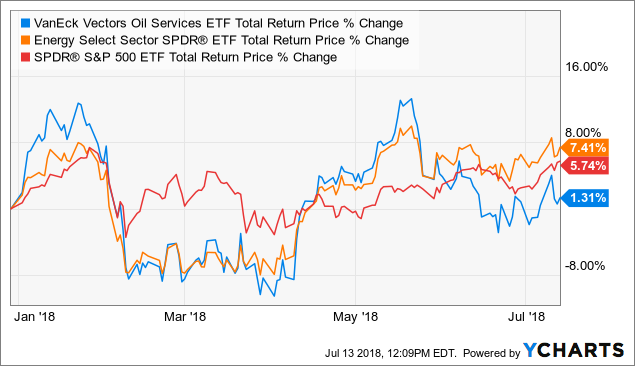
I’m still a believer in energy ETFs here. I think that the strong earnings growth that’s expected to come with higher oil prices is not fully being reflected in the sector’s returns. This area will no doubt be volatile for, probably, the rest of 2018. If you’re willing to ride it out, I think there are further gains to be had. Given some of the global political tensions and concerns over the global economy, I’d expect the price of oil to drift back into the mid-$60s as it tries to establish a new normal.
Is Gold Going Up or Down?
Gold is something that I haven’t spent a whole lot of time on this year. The precious metal has been mostly a declining asset during the 2nd quarter with prices about $100 per ounce off of earlier year highs.
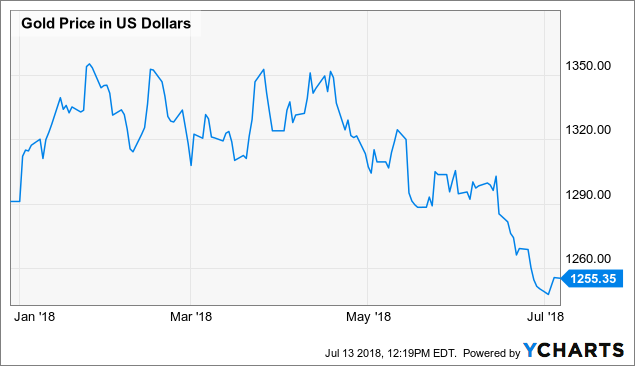
Treasuries seem to have replaced gold as the go-to safe haven asset of choice lately. A lower demand for risky assets should be in gold’s favor but that just hasn’t been the case. If Treasury yields drop further, I could see a rally in gold again, but at this point I don’t see a catalyst for a big move in the near-term.
Carnage in Cryptos
This nifty little chart from Charlie Bilello pretty much says it all.
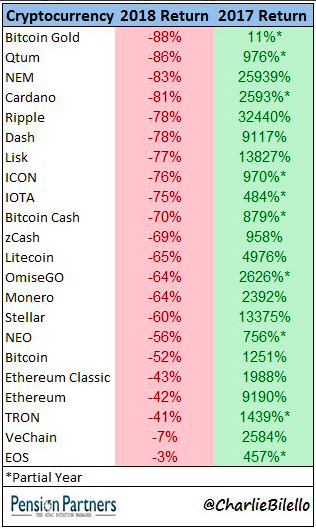
After last year’s bubbly rally, almost everything has come crashing back down to earth. I’m not a crypto investor, nor will I likely be, but I did find interesting the filing for the VanEck Solid X Bitcoin Trust ETF (XBTC), the latest attempt to bring bitcoin to the ETF masses.
I covered it here about a month ago. I think the fact that it addresses some of the concerns brought forth by the SEC when it essentially rejected all bitcoin ETF proposals, it probably has the best chance yet of getting approved, but I still think this one gets the thumbs down. I don’t get the sense that the SEC’s position has changed at all, but I’m sure a cryptocurrency ETF will hit the market eventually.
Conclusion
In the short term, I think the markets are still in fairly good shape, but there are signs that investors are getting more defensive. Flows into Treasuries, utilities and staples suggest that investors are getting a little worried about the trade war with China and how that could impact economic activity globally. It will almost certainly have a negative impact on GDP growth, but the bigger question is how long it could go on for. There’s little reason to believe that either side is willing to budge, and the longer this carries on, the worse it figures to get.
Heading into the 2nd half of 2018, I’m liking small-caps and consumer staples, but I’m nervous about energy and financials. I don’t think there’s any real obvious candidate for an outperformer in the 2nd half other than maybe Treasuries or short-term corporate bonds. Most sectors will be affected by a global slowdown, so defensive posturing could be the theme over the next few months.
Editor’s Note: Dave Dierking’s ETF Focus is dedicated to helping investors make smart investing decisions and develop broader investing strategies using, you guessed it, ETFs! If you’re interested in joining our growing ETF community, now’s the perfect time!
With your subscription, you’ll receive:
- Twice-weekly “ETFs in Focus” features where I present my top ETF ideas.
- ETF-based model portfolios for dividend income, target yields, and low fees.
- ETF power rankings covering hundreds of funds in two dozen categories.
- First access to ETF trade ideas every month.
Click HERE now to learn more!
Disclosure: I am long OIH.
