
Thought to Ponder…
“The true hero is flawed. The true test of a champion is not whether he can triumph, but whether he can overcome obstacles—preferably of his own making—in order to triumph. A hero without a flaw is of no interest to an audience or to the universe, which, after all, is based on conflict and opposition, the irresistible force meeting the unmovable object.”
– Garth Stein
“The Art of Racing in the Rain”
The View From 30,000 Feet
The closing of the week, also marked the closing of the month and the quarter. It was a quarter marked by transition. A transition that began the year with an oversold market and an overwhelming majority forecaster projecting an economic slowdown that would force the Fed to ease in 2023. Soon after, a sharp rally in equity price and surprisingly strong growth rekindled fears of inflation, pricing out rate cuts in 2023. Not to be outdone, the most recent bout of market action included a banking crisis accompanied with concerns of tightening credit conditions and a brewing asset crisis in commercial real estate, which led to an aggressively repricing for rate cuts. By the final day of the March, the banking system looked to be on its way to stabilization and fresh readings on inflation provided few signs of meaningful progress, driving hawkish rhetoric from the Fed, which once again began tipping expectations back towards less accommodative policy. Miraculously, the net result of the schizophrenic market dynamics was higher equity prices, confounding managers of risk, who have been sidelined by some of the wildest shifts in narratives and volatility since the Great Financial Crisis.
- The quarter closes with a narrow rally in the largest names in the S&P500 driving index performance
- The latest PCE readings provide the Fed fuel for continued hawkish rhetoric, but the outlook is in the eye of beholder
- Lesson from past cycles… S&P500 performance prior to and following the first Fed rate cut
- The most Frequently Asked Question from client’s this week: What’s the prevailing narrative driving the markets?
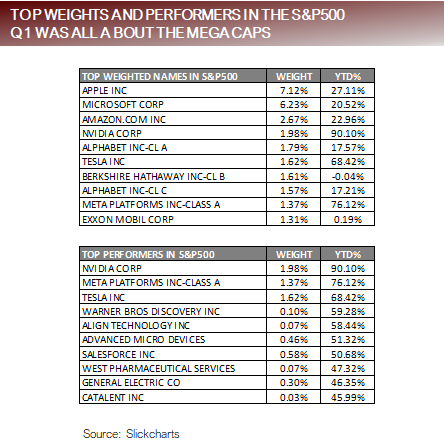
The Quarter Closes With a Narrow Rally in the Largest Names in the S&P500
- The S&P500 closed the quarter up 03% YTD.
- The top weighted 10 companies in the S&P500 account for 27% of the index. The average return of the top 10 companies was 34.02% for the quarter, with the remaining 490 companies having an average return of only 2.64% for the quarter. 221 of S&P500 companies posted negative returns for the quarter.
- Based on attribution analysis, the top 10 highest weighted companies in the S&P500 contributed to an 34% increase in the S&P500, or 119% of total index performance. This includes 2 companies in the top 10, Berkshire Hathaway and Exxon Mobil, that provided zero positive return attribution, meaning it was 8 out of the top 10 names that drove the entire 119%.
- The top 10 best performing companies in the S&P500 account for a weight of 58% of the index. The average return of the best performing 10 companies was 59.40%. Based on attribution analysis, the 3 top performing companies contributed to a 4.75% increase in the S&P500, or 68% of total index performance.
- Three sectors drove performance in Q1 The Information Technology Sector of the S&P500 was up 24.09% for the quarter, Communication Services Sector was up 20.50% for the quarter and Consumer Discretionary was up 16.80% for the quarter. The remaining 8 Sectors were down an average of -0.66% for the quarter.
Narrow Performance in Companies, Where Size and Sector Drove Index Performance

The Latest PCE Readings Provide the Fed Fuel for Continued Hawkish Rhetoric
- Friday’s PCE release continued to show inflation above the Fed’s comfort levels, which was reenforced by comments from Boston Fed President Susan Collins shortly after numbers hit the However, the outlook can be skewed either positively or negatively depending on which cross sections of data are highlighted.
- The Pessimistic Case for inflation continuing be a problem and hawkish Fed viewpoint
-
-
- Super Core PCE (Services ex-housing), the measure the Fed has called out as important, accelerated from 55% to 4.63%.
- The breadth of inflationary pressures is still elevated with nearly 75% of goods used to calculate CPI still rising at an annualized pace of more than 6%.
- Although wage pressures have eased slightly, the Atlanta Fed Wage Tracker is measuring 1%, over double pre-pandemic levels.
- Sticky inflation is showing few signs of decelerating, having accelerated from 67% to 6.71% in the latest CPI reading.
- Although housing is expected to begin detracting from inflation in Q2, signs are that the housing and rental markets have stabilized and may only provide temporary Apartment List shows rental prices increased each of the last two months.
-
-
- The Optimistic Case for inflation trending lower which may allow the Fed to back away
- Surveys of inflation expectations are The University of Michigan 1 year Inflation Expectations peaked at 5.4% in April 2022 and has since falling to 3.6%, its lowest level since April of 2021.
- Market based measures of inflation such as breakevens and inflation swaps indicate long-term expectations inflation remain anchored, and trading below 2.5%.
- The labor market is tightening, with the Quits Rate down from 0% to 2.5% and approaching pre-pandemic trend of 2.3%.
- Over time hours and temp workers, which both lead the employment market, are signaling a tightening of labor market
- The Optimistic Case for inflation trending lower which may allow the Fed to back away
- The Fed could easily transition to a less hawkish stance if they chose to change data they focus on to forecast the trends.
Too Early to Sound the All-Clear Alarm for Inflation


Lesson From Past Cycles… S&P500 Performance Prior to and Following Fed Cuts
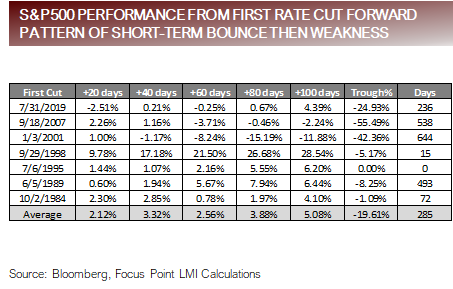
- We analyzed the periods leading up to and following the first rate cut over the last 7 rate cycles dating back to 1984, measuring the S&P500’s performance on either side of the first rate cut, with the following observations:
- The average return leading up to the first rate cut was positive, with the largest gain to be found within 80 to 100 days prior to the rate cut.
- The average return following the first rate cut was positive in the intermediate-term, with a trend of increased performance over the first several months following the first rate cut.
- In all but one instance the S&P500 ultimately traded lower than the date of the first rate cut, with the average period to reach the trough of 285 days, and an average drawdown of -19.61% from the date of the first rate cut.
- The past 3 rate cutting cycles were significantly different the first 4 rate cutting cycles During the most recent 3 rate cutting cycles it took an average of 473 days for S&P500 trough, with an average drawdown of -40.92% from the date of the first rate cut.
- The change in pattern probably reflects a change in leadership, tools, application of policy and attributes of the events that led up to the rate We’d caution looking at the number in isolation of the details surrounding each cycle.
- 1998 was an outlier and skewed the The Fed rate cutting campaign in 1998 was a result of the Russian default and ensuing Emerging Market Debit Crisis that took down Long-Term Capital Management. This was unusual in the series because it was associated with a triggering event, which generated an exaggerated V pattern.
Short-Term Movements Pre and Post First Rate Cut Positive, but Longer-Term Drawdowns Likely

FAQ: What’s the Prevailing Narrative Driving the Markets?
- There are three dominate viewpoints in the markets:
- The Fed Higher for Longer Viewpoint (approximated by the Dot Plot)
- Inflation has begun to move lower but is still too The Fed’s job won’t be done until they are assured that inflation is moving on a path towards its long-term target and will continue to pursue restrictive policy until inflation risks are contained.
- There are potential liquidity and credit event risks that may lead to unacceptably high unemployment and downside growth outcomes, but the risk are worth facing because without price stability the risk inflation poses to the economy are even greater.
- The Bear Case / Unavoidable Path Viewpoint (approximated by the Fed Funds Forward Curve)
- Severe damage to the economy has already been done by the pace and magnitude of interest rate increases, quantitative tightening and contraction of money supply.
- Forward looking measures of the economy such a Leading Economic Indicators and the yield curve are signaling a recession, and the Fed will not be able to avert a severe downturn.
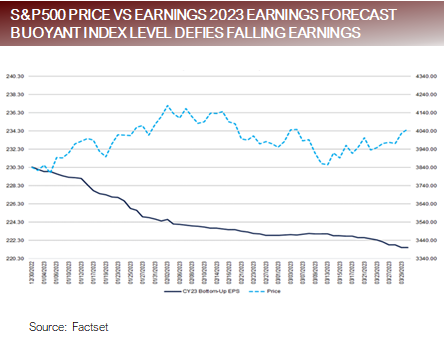
- Earnings estimates are too high given the current economic backdrop, while valuations are trading above long-term averages, creating potential for significantly lower index prices.
- The Fed will need cut rates to avoid a severe economic downturn.
- The Bull Case / Momentum Viewpoint (approximated by equity market performance)
- The economy will continue to defy gravity and prognosticators of doom, expanding above expectations as it did in Q1 2023.
- The job market will remain strong based on demographic dynamics, consumers will remain flush with cash from pandemic savings and cost of living adjustments allowing them to maintain spending and continue to prop up earnings.
- The Fed Higher for Longer Viewpoint (approximated by the Dot Plot)
Market Expectations for Rates Moving Towards Fed Guidance and Index Price Defiant of Earnings

Putting It All Together
- A chaotic quarter, marked by wild gyrations in market expectations for Fed policy, a banking crisis and a narrow rotation into the largest names in the index comes to a close.
- If we had told you at the end of 2022 that the quarter would bring expectations for a higher Fed Funds Rate than previously anticipated, a banking crisis that would include the second largest banking failure in S. history and one of Switzerland’s most prestigious banking being taken down, with volatility in Treasuries on par with the Great Financial crisis and falling earnings expectations, it’s unlikely you would have guessed that the S&P500 would be up over 7% when the dust settled.
- A week has passed without the banking crisis worsening, and churn of deposits from smaller banks to larger banks has eased.
- With the backstops policy makers have put into place appearing having ringfenced the banking problems and few signs that the outlook for inflation is on a rapid path to improvement, market expectations for Fed Funds are beginning to move back towards Fed projections of higher for longer.
- The Fed’s Higher for Longer Viewpoint of higher for longer and the Bear Case / Unavoidable Path Viewpoint are converging on a path that projects further Fed Funds Rate increases, while the Bull Case / Momentum Viewpoint continues to power forward, fueled by economic data that defies expectations.
- The markets will need resolve that if the Bear Case is correct, rates will need to fall faster than forecast, and if the Bull case is correct, rates will need to rise more than forecast.
Originally published by Focus Point on April 3, 2023.
For more news, information, and analysis, visit the Portfolio Strategies Channel.
DISCLOSURES AND IMPORTANT RISK INFORMATION
Performance data quoted represents past performance, which is not a guarantee of future results. No representation is made that a client will, or is likely to, achieve positive returns, avoid losses, or experience returns similar to those shown or experienced in the past.
Focus Point LMI LLC
For more information, please visit www.focuspointlmi.com or contact us at [email protected] Copyright 2023, Focus Point LMI LLC. All rights reserved.
The text, images and other materials contained or displayed on any Focus Point LMI LLC Inc. product, service, report, e-mail or web site are proprietary to Focus Point LMI LLC Inc. and constitute valuable intellectual property and copyright. No material from any part of any Focus Point LMI LLC Inc. website may be downloaded, transmitted, broadcast, transferred, assigned, reproduced or in any other way used or otherwise disseminated in any form to any person or entity, without the explicit written consent of Focus Point LMI LLC Inc. All unauthorized reproduction or other use of material from Focus Point LMI LLC Inc. shall be deemed willful infringement(s) of Focus Point LMI LLC Inc. copyright and other proprietary and intellectual property rights, including but not limited to, rights of privacy. Focus Point LMI LLC Inc. expressly reserves all rights in connection with its intellectual property, including without limitation the right to block the transfer of its products and services and/or to track usage thereof, through electronic tracking technology, and all other lawful means, now known or hereafter devised. Focus Point LMI LLC Inc. reserves the right, without further notice, to pursue to the fullest extent allowed by the law any and all criminal and civil remedies for the violation of its rights.
All unauthorized use of material shall be deemed willful infringement of Focus Point LMI LLC Inc. copyright and other proprietary and intellectual property rights. While Focus Point LMI LLC will use its reasonable best efforts to provide accurate and informative Information Services to Subscriber, Focus Point LMI LLC but cannot guarantee the accuracy, relevance and/or completeness of the Information Services, or other information used in connection therewith. Focus Point LMI LLC, its affiliates, shareholders, directors, officers, and employees shall have no liability, contingent or otherwise, for any claims or damages arising in connection with (i) the use by Subscriber of the Information Services and/or (ii) any errors, omissions or inaccuracies in the Information Services. The Information Services are provided for the benefit of the Subscriber. It is not to be used or otherwise relied on by any other person. Some of the data contained in this publication may have been obtained from The Federal Reserve, Bloomberg Barclays Indices; Bloomberg Finance L.P.; CBRE Inc.; IHS Markit; MSCI Inc. Neither MSCI Inc. nor any other party involved in or related to compiling, computing or creating the MSCI Inc. data makes any express or implied warranties or representations with respect to such data (or the results to be obtained by the use thereof), and all such parties hereby expressly disclaim all warranties of originality, accuracy, completeness, merchantability or fitness for a particular purpose with respect to any of such data. Such party, its affiliates and suppliers (“Content Providers”) do not guarantee the accuracy, adequacy, completeness, timeliness or availability of any Content and are not responsible for any errors or omissions (negligent or otherwise), regardless of the cause, or for the results obtained from the use of such Content. In no event shall Content Providers be liable for any damages, costs, expenses, legal fees, or losses (including lost income or lost profit and opportunity costs) in connection with any use of the Content. A reference to a particular investment or security, a rating or any observation concerning an investment that is part of the Content is not a recommendation to buy, sell or hold such investment or security, does not address the suitability of an investment or security and should not be relied on as investment advice.
Important Disclosures
This communication reflects our analysts’ current opinions and may be updated as views or information change. Past results do not guarantee future performance. Business and market conditions, laws, regulations, and other factors affecting performance all change over time, which could change the status of the information in this publication. Using any graph, chart, formula, model, or other device to assist in making investment decisions presents many difficulties and their effectiveness has significant limitations, including that prior patterns may not repeat themselves and market participants using such devices can impact the market in a way that changes their effectiveness. Focus Point LMI LLC believes no individual graph, chart, formula, model, or other device should be used as the sole basis for any investment decision. Focus Point LMI LLC or its affiliated companies or their respective shareholders, directors, officers and/or employees, may have long or short positions in the securities discussed herein and may purchase or sell such securities without notice. Neither Focus Point LMI LLC nor the author is rendering investment, tax, or legal advice, nor offering individualized advice tailored to any specific portfolio or to any individual’s particular suitability or needs. Investors should seek professional investment, tax, legal, and accounting advice prior to making investment decisions. Focus Point LMI LLC’s publications do not constitute an offer to sell any security, nor a solicitation of an offer to buy any security. They are designed to provide information, data and analysis believed to be accurate, but they are not guaranteed and are provided “as is” without warranty of any kind, either express or implied.
FOCUS POINT LMI LLC DISCLAIMS ANY AND ALL EXPRESS OR IMPLIED WARRANTIES, INCLUDING, BUT NOT LIMITED TO, ANY WARRANTIES OF MERCHANTABILITY, SUITABILITY OR FITNESS FOR A PARTICULAR PURPOSE OR USE.
Focus Point LMI LLC, its affiliates, officers, or employees, and any third-party data provider shall not have any liability for any loss sustained by anyone who has relied on the information contained in any Focus Point LMI LLC publication, and they shall not be liable to any party for any direct, indirect, incidental, exemplary, compensatory, punitive, special or consequential damages, costs, expenses, legal fees, or losses (including, without limitation, lost income or lost profits and opportunity costs) in connection with any use of the information or opinions contained Focus Point LMI LLC publications even if advised of the possibility of such damages.
