
Several key economic indicators are released every week to help provide insight into the overall health of the U.S. economy. Policymakers and advisors closely monitor these indicators to understand the direction of interest rates. The data trends can significantly impact business decisions and financial markets. Last week, a handful of releases provided insight on the current state of the housing market, and this article takes a deeper look into three of them: existing home sales, building permits, and housing starts. These indicators will have an impact on home builders and residential real estate ETFs such as Invesco Dynamic Building & Construction ETF (PKB), iShares U.S. Home Construction ETF (ITB), SPDR S&P Homebuilders ETF (XHB), and iShares Residential and Multisector Real Estate ETF (REZ).
In the week ending on May 18th, the SPDR S&P 500 ETF Trust (SPY) rose 1.72% while the Invesco S&P 500® Equal Weight ETF (RSP) was up 1.22%.
Existing Home Sales
Existing home sales retreated for a second straight month in April, slowing the momentum from a few months before. The existing home inventory is currently extremely limited. Homebuyers are reluctant to deal with the prevailing high mortgage rates in the market. As a result, existing home sales fell 3.4% in April to a seasonally adjusted annual rate of 4.28 million units. The latest data came in below expectations of a 0.1% month-over-month increase to 4.30 million units.
The scarcity of available homes has created intense competition among buyers, leading to multiple offers and subsequent price increases. In April, the median price for an existing home climbed for the third consecutive month to $388,800. This marks a 3.6% rise from March and the largest monthly increase in a year.

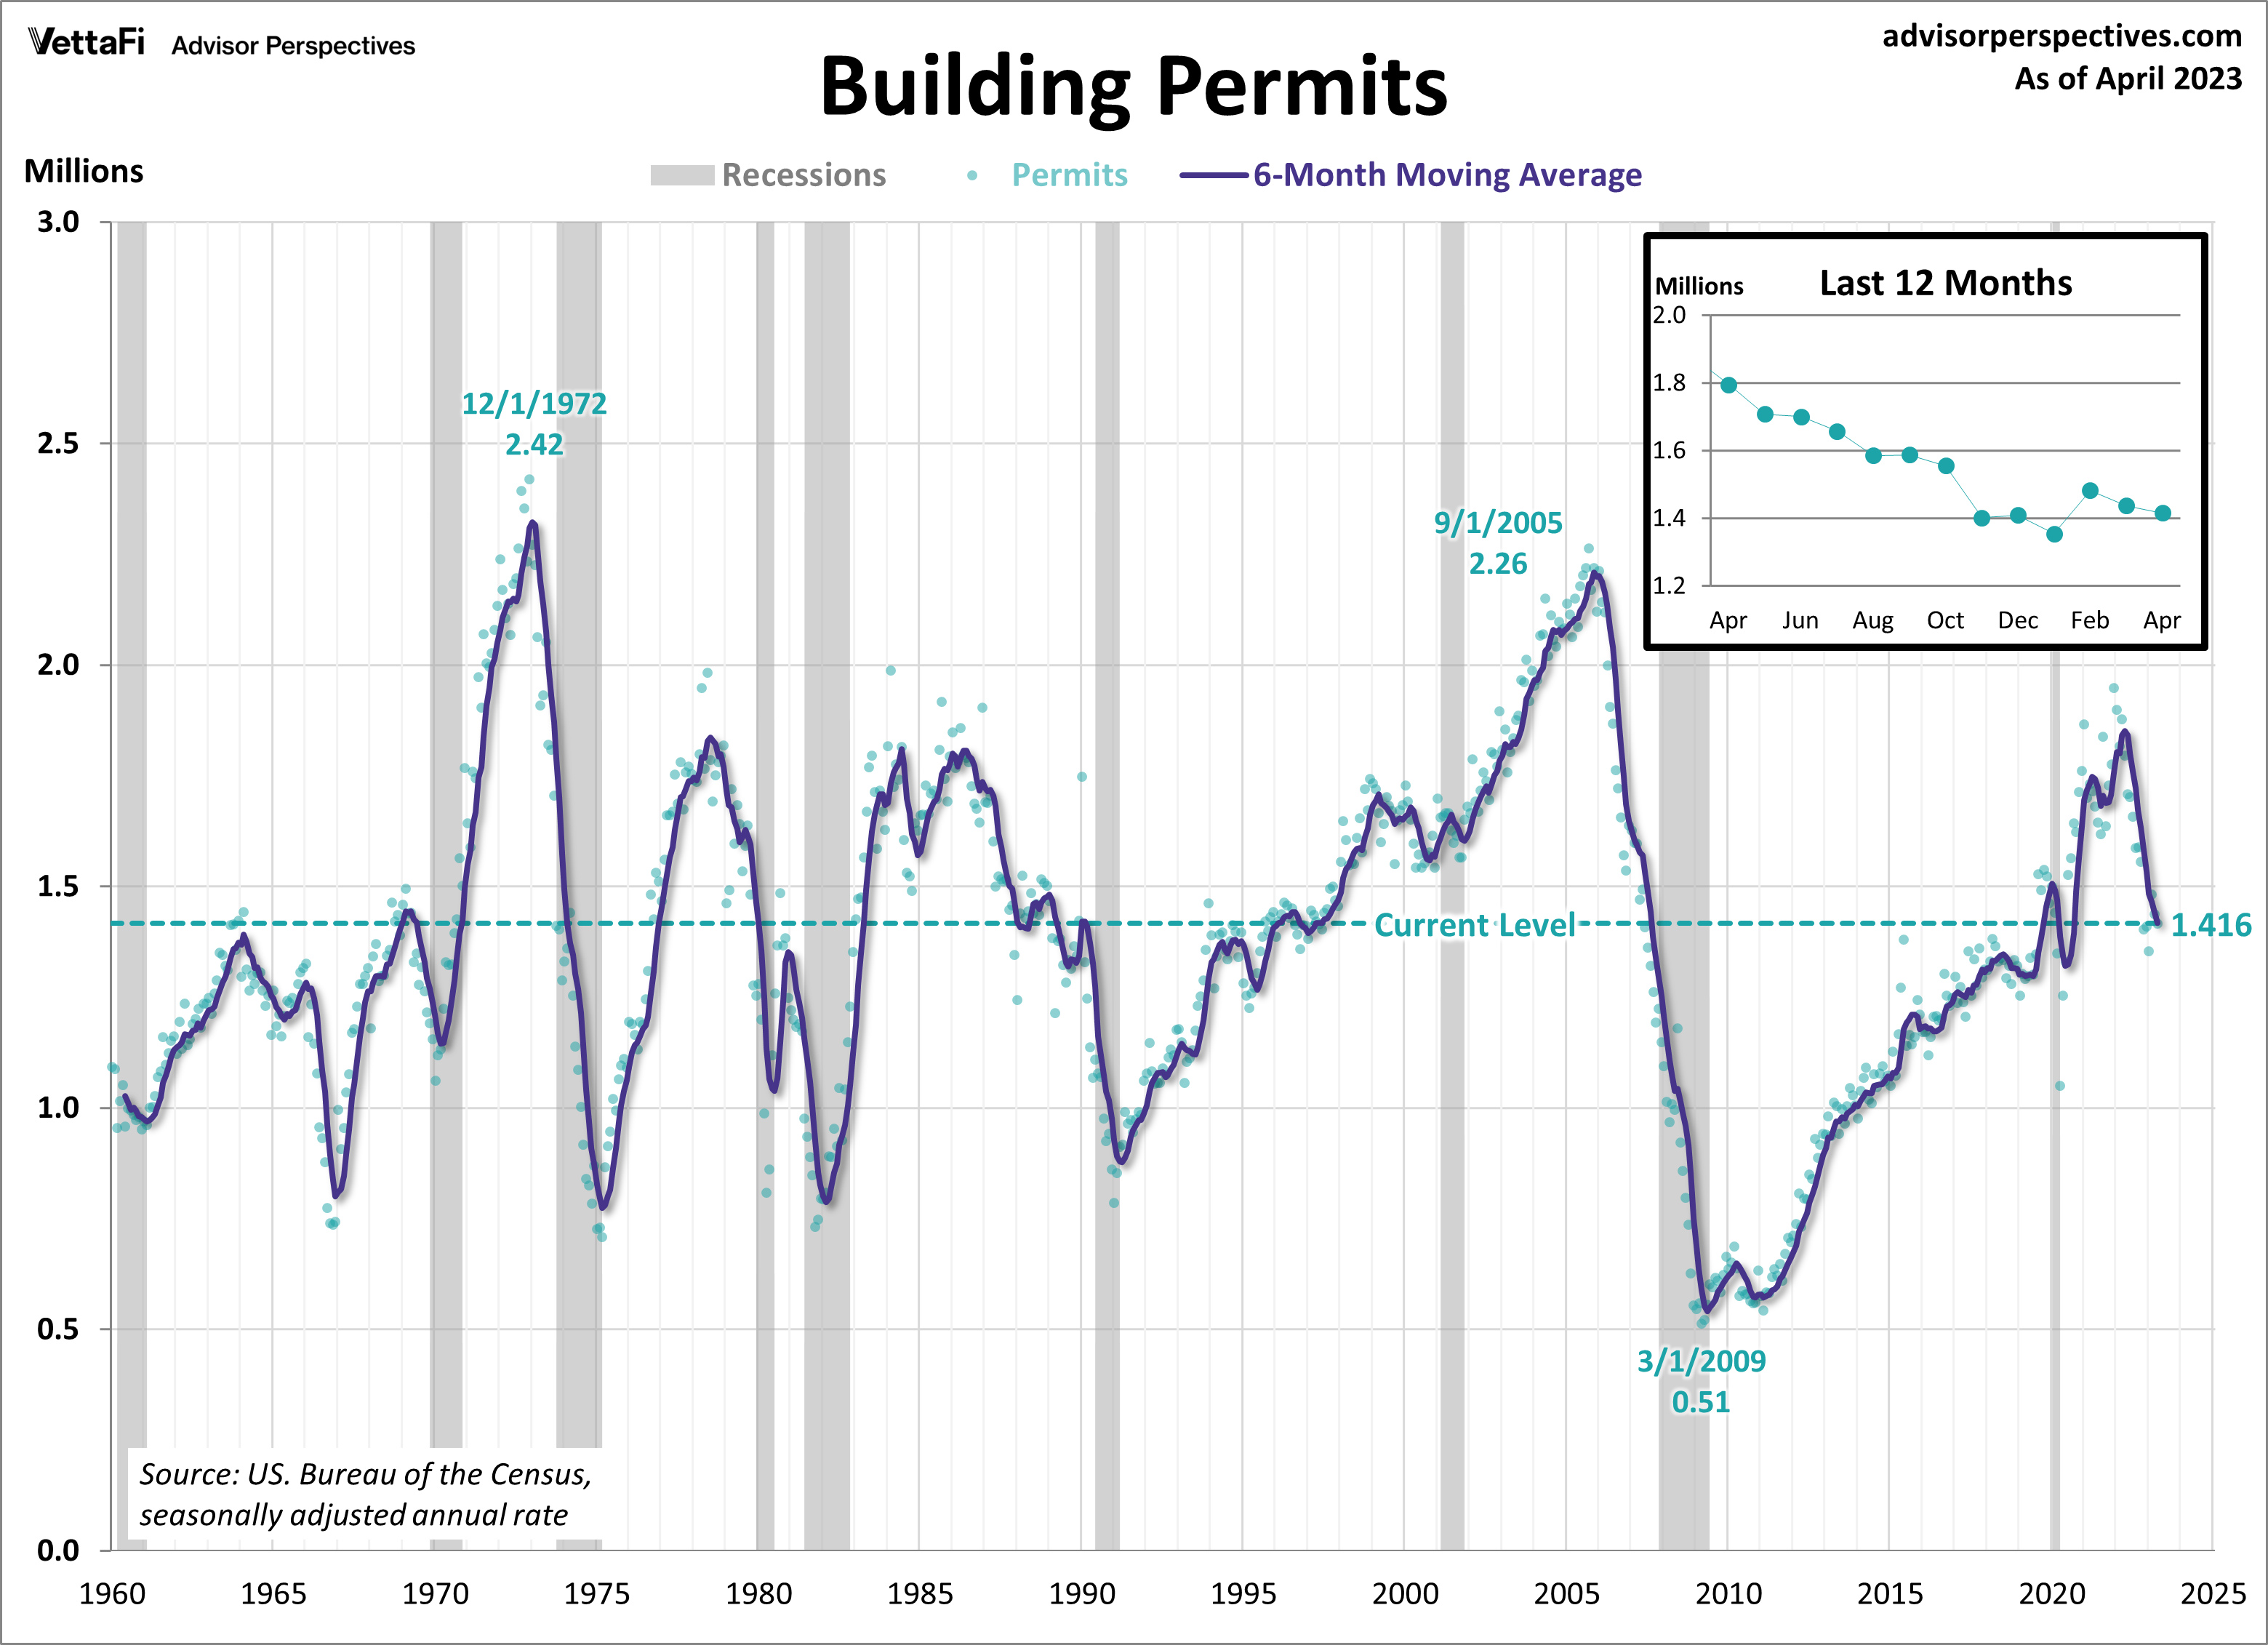
Building Permits
New residential building permits continued to slow in April for a second straight month. Building permits provide a sense of future construction activity and therefore serve as a key indicator of housing market demand. Last month, building permits fell 1.5% from March to a seasonally adjusted annual rate of 1.416 million units. The latest reading was below the expected 1.437 million units. Permits are down 21.1% compared to one year ago, marking the ninth consecutive month of annual declines.
In the face of these negative statistics, it’s worth mentioning that builder confidence rose last week for the fifth straight month to its highest level in ten months. The lack of inventory in the resale market has boosted builder confidence. Despite this, homebuilders deal with ongoing material issues and tightening credit conditions.
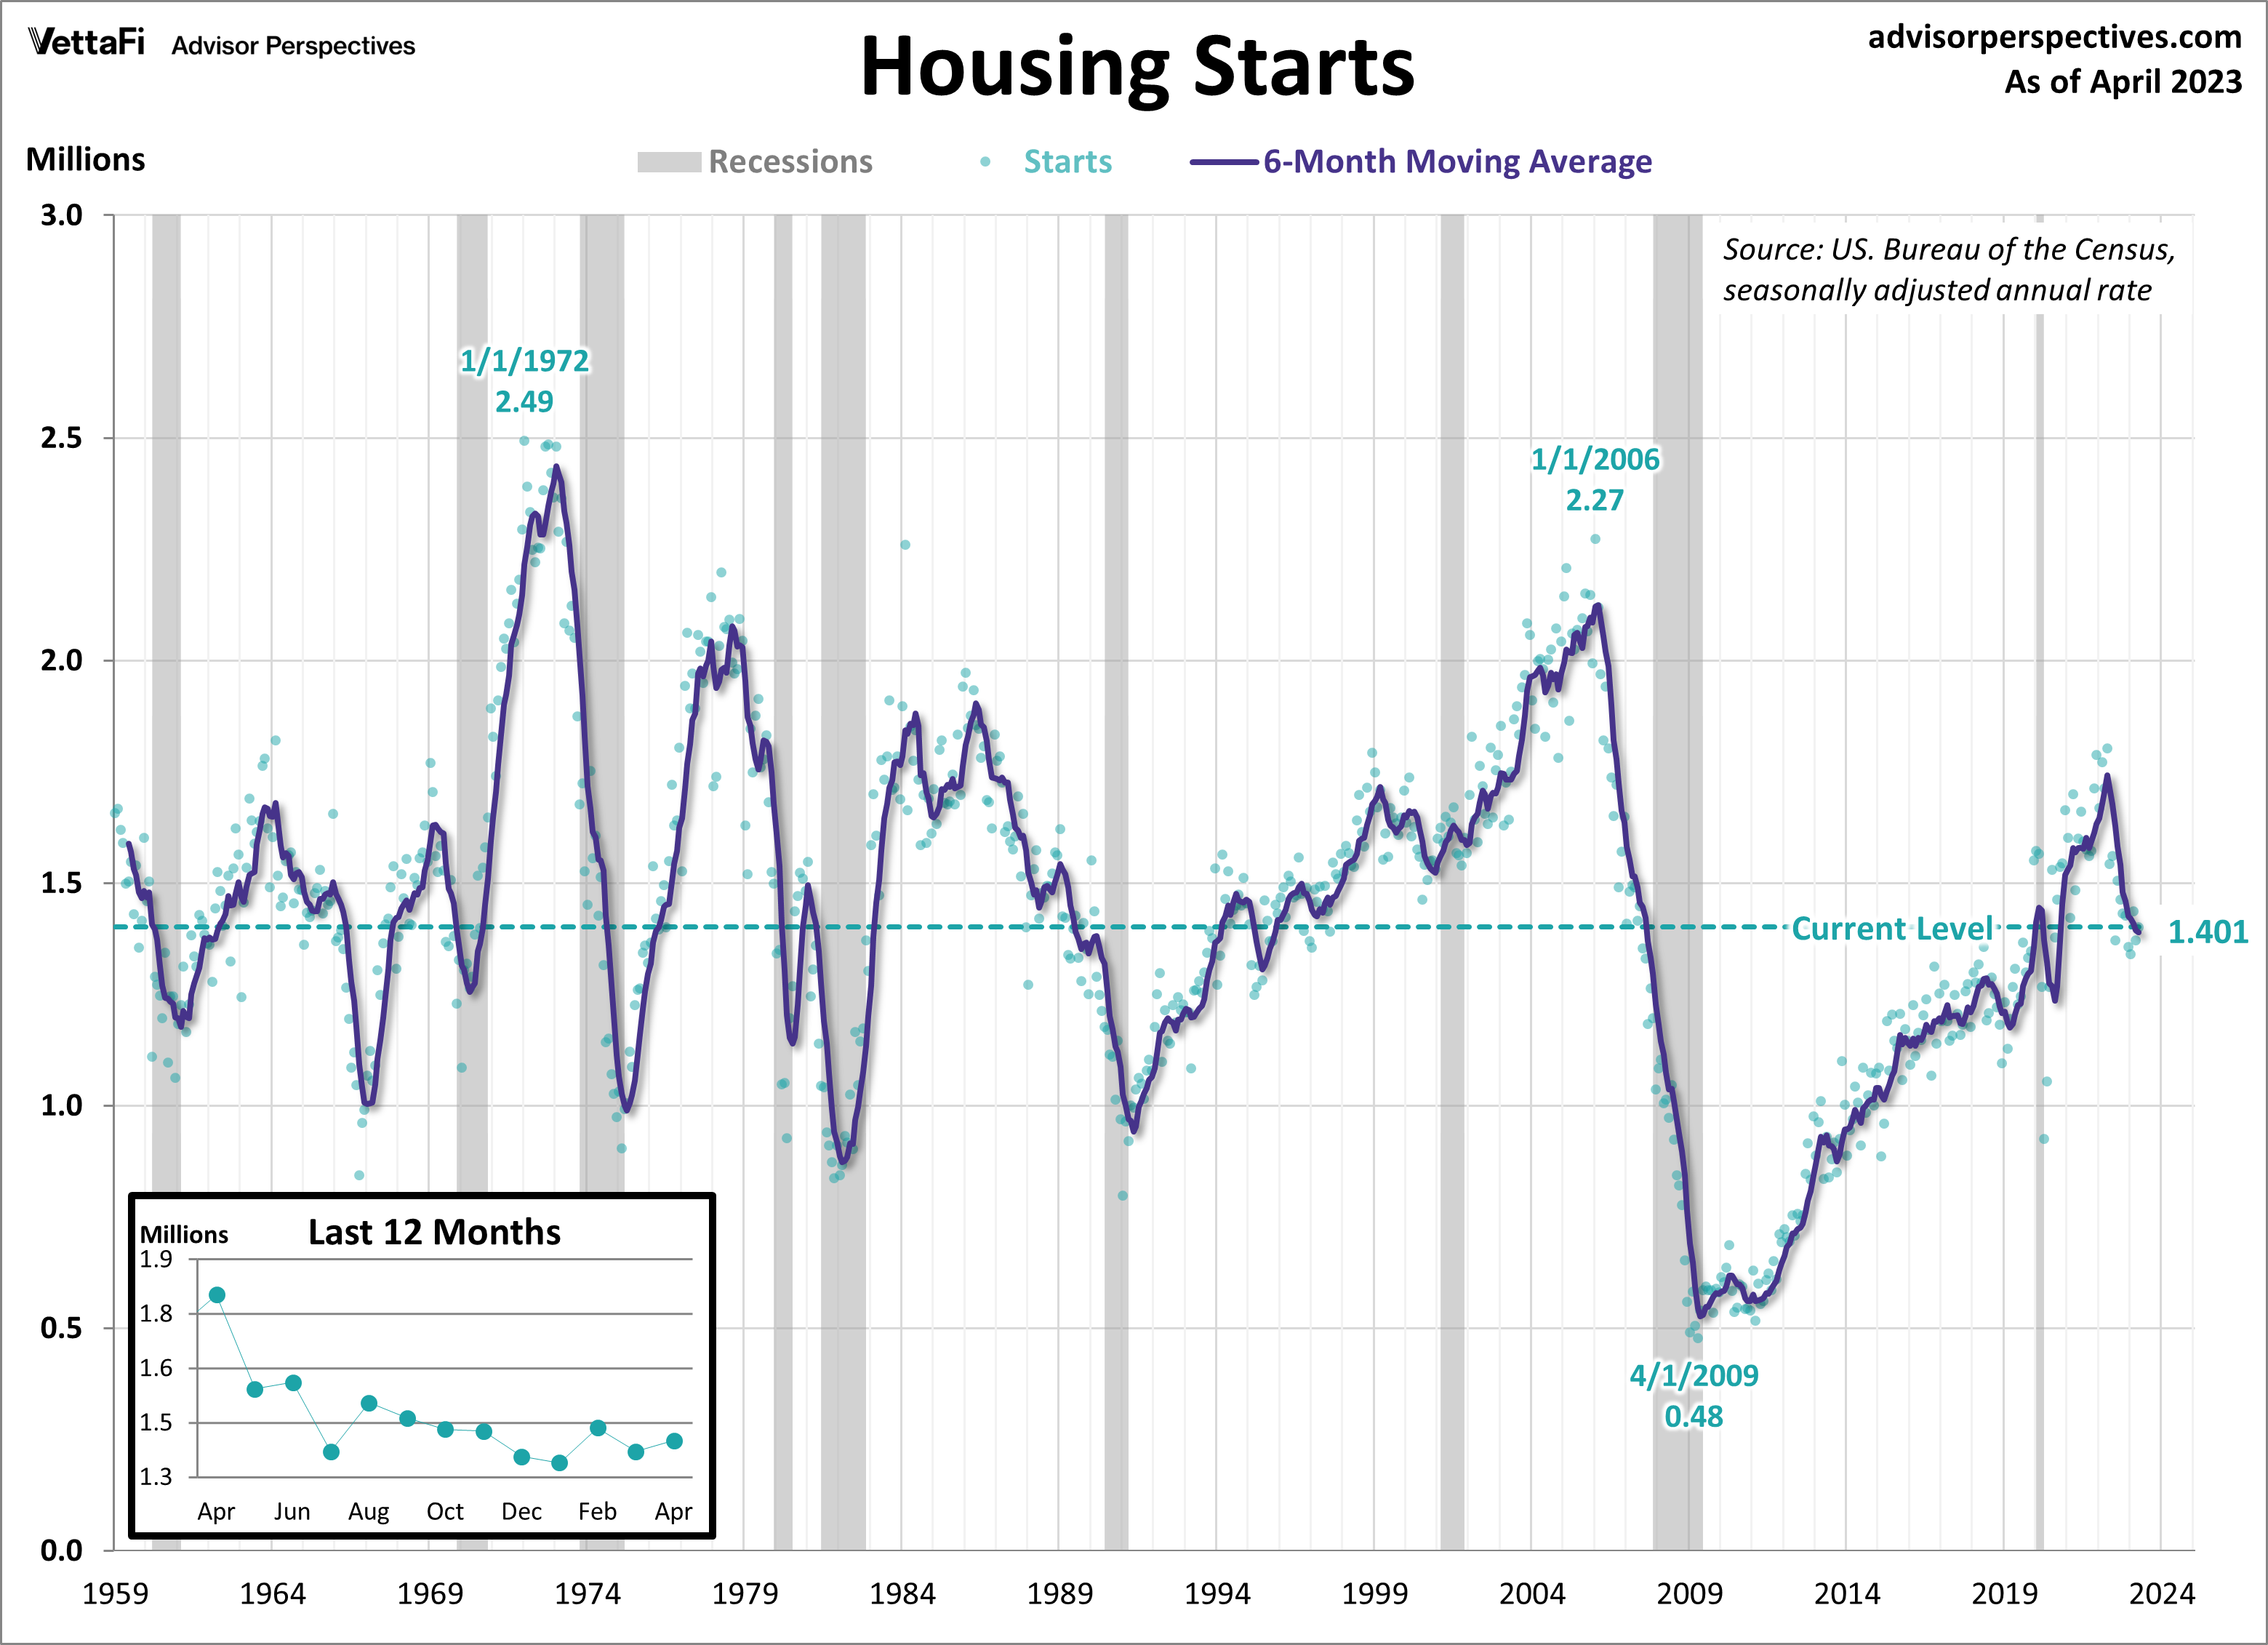
Housing Starts
Housing starts rebounded by 2.2% in April to a seasonally adjusted annual rate of 1.401 million units. A deeper look at the data showed single-family homes and multi-family units bounced back by 1.6% and 5.2%, respectively. The traction gained this month reflects consumers’ increased attention to new construction housing amid limited inventory in existing homes. Despite last month’s increase, the pace of new construction remains considerably slower than the building surge seen from mid-2020 to mid-2022. Starts are down 22.3% from April of last year. This marks the twelfth consecutive month of annual declines and the lowest since December.
This week, keep an eye out for the highly anticipated 2023 Q1 GDP second estimate as well as April’s data on the personal consumption expenditures (PCE) index and new orders for durable goods. The data will provide insights into the spending patterns of both consumers and businesses, and how the growth of the overall economy is influenced by these patterns. The 2023 Q1 second estimate is forecasted to come in at 1.1%, unchanged from the Q1 advance estimate and down from the 2022 Q4 final estimate of 2.6%. The core PCE price index, the Fed’s preferred inflation measure, is expected to come in at 4.6% year-over-year and 0.3% month-over-month, both unchanged from last month. New orders for durable goods are expected to have dropped in April by 1.1% after an unexpected rise in March.
For more news, information, and analysis, visit the Portfolio Strategies Channel.
