
A few key economic data points were released last week that provided insight into the overall state of the U.S. economy. In this article, we take a deeper look at three of the most important economic releases from the past week – the consumer price index, producer price index, and retail sales. Economic indicators, such as these three, are closely watched by policymakers and advisors trying to understand the direction of interest rates because the data can have a significant impact on business decisions and financial markets. In the week ending on April 13th, the SPDR S&P 500 ETF Trust (SPY) rose 1.05% while the Invesco S&P 500® Equal Weight ETF (RSP) was up 1.55%.
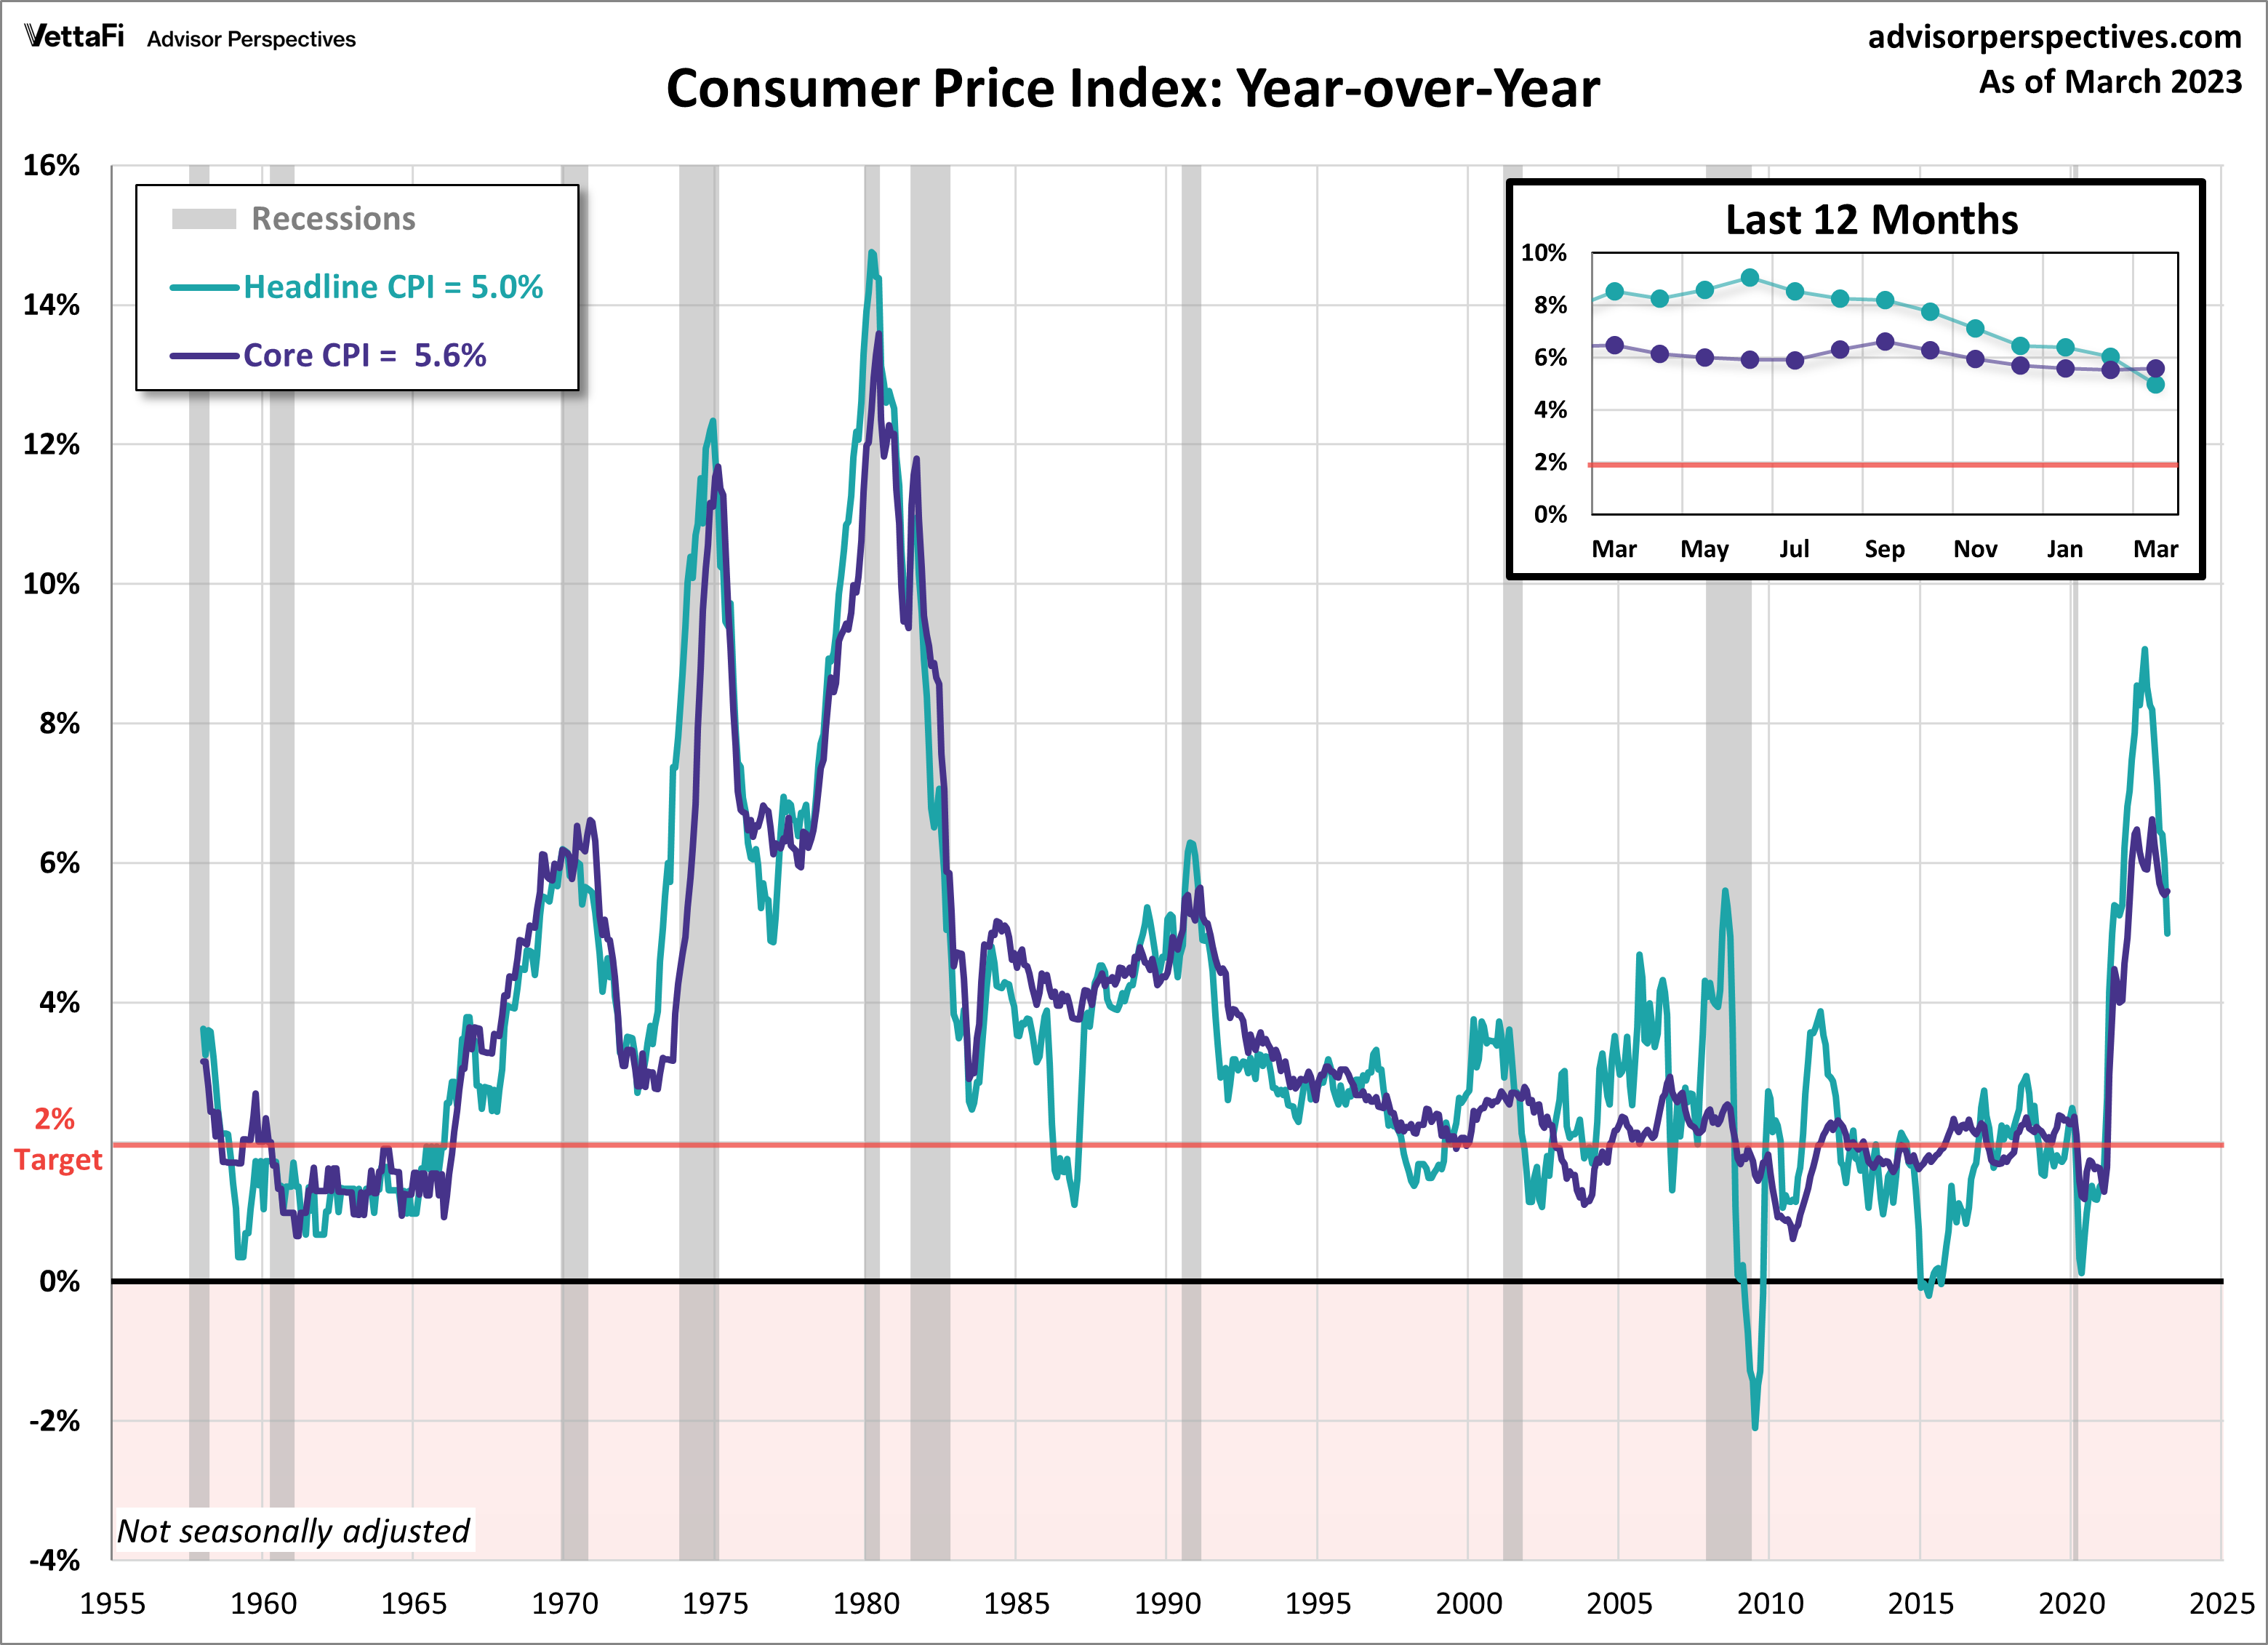
Consumer Price Index (CPI)
In March, the consumer price index (CPI) increased by 5.0% compared to the previous year, down from February’s 6.0% and lower than the expected 5.2%. This marks the ninth consecutive month that inflation has fallen annually, reaching its lowest level since April 2021. Every month, headline prices continued to cool down with a 0.1% increase from the previous month, down from February’s 0.4% increase. However, core CPI (excluding food and energy) prices maintained their pace with a 0.4% monthly increase, and for the first time in six months, accelerated with a 5.6% year-over-year increase. This is the first time in over two years that core CPI has exceeded the overall measure. While the latest numbers are still well above the Fed’s 2% target rate, inflation continues to cool and head in the right direction.
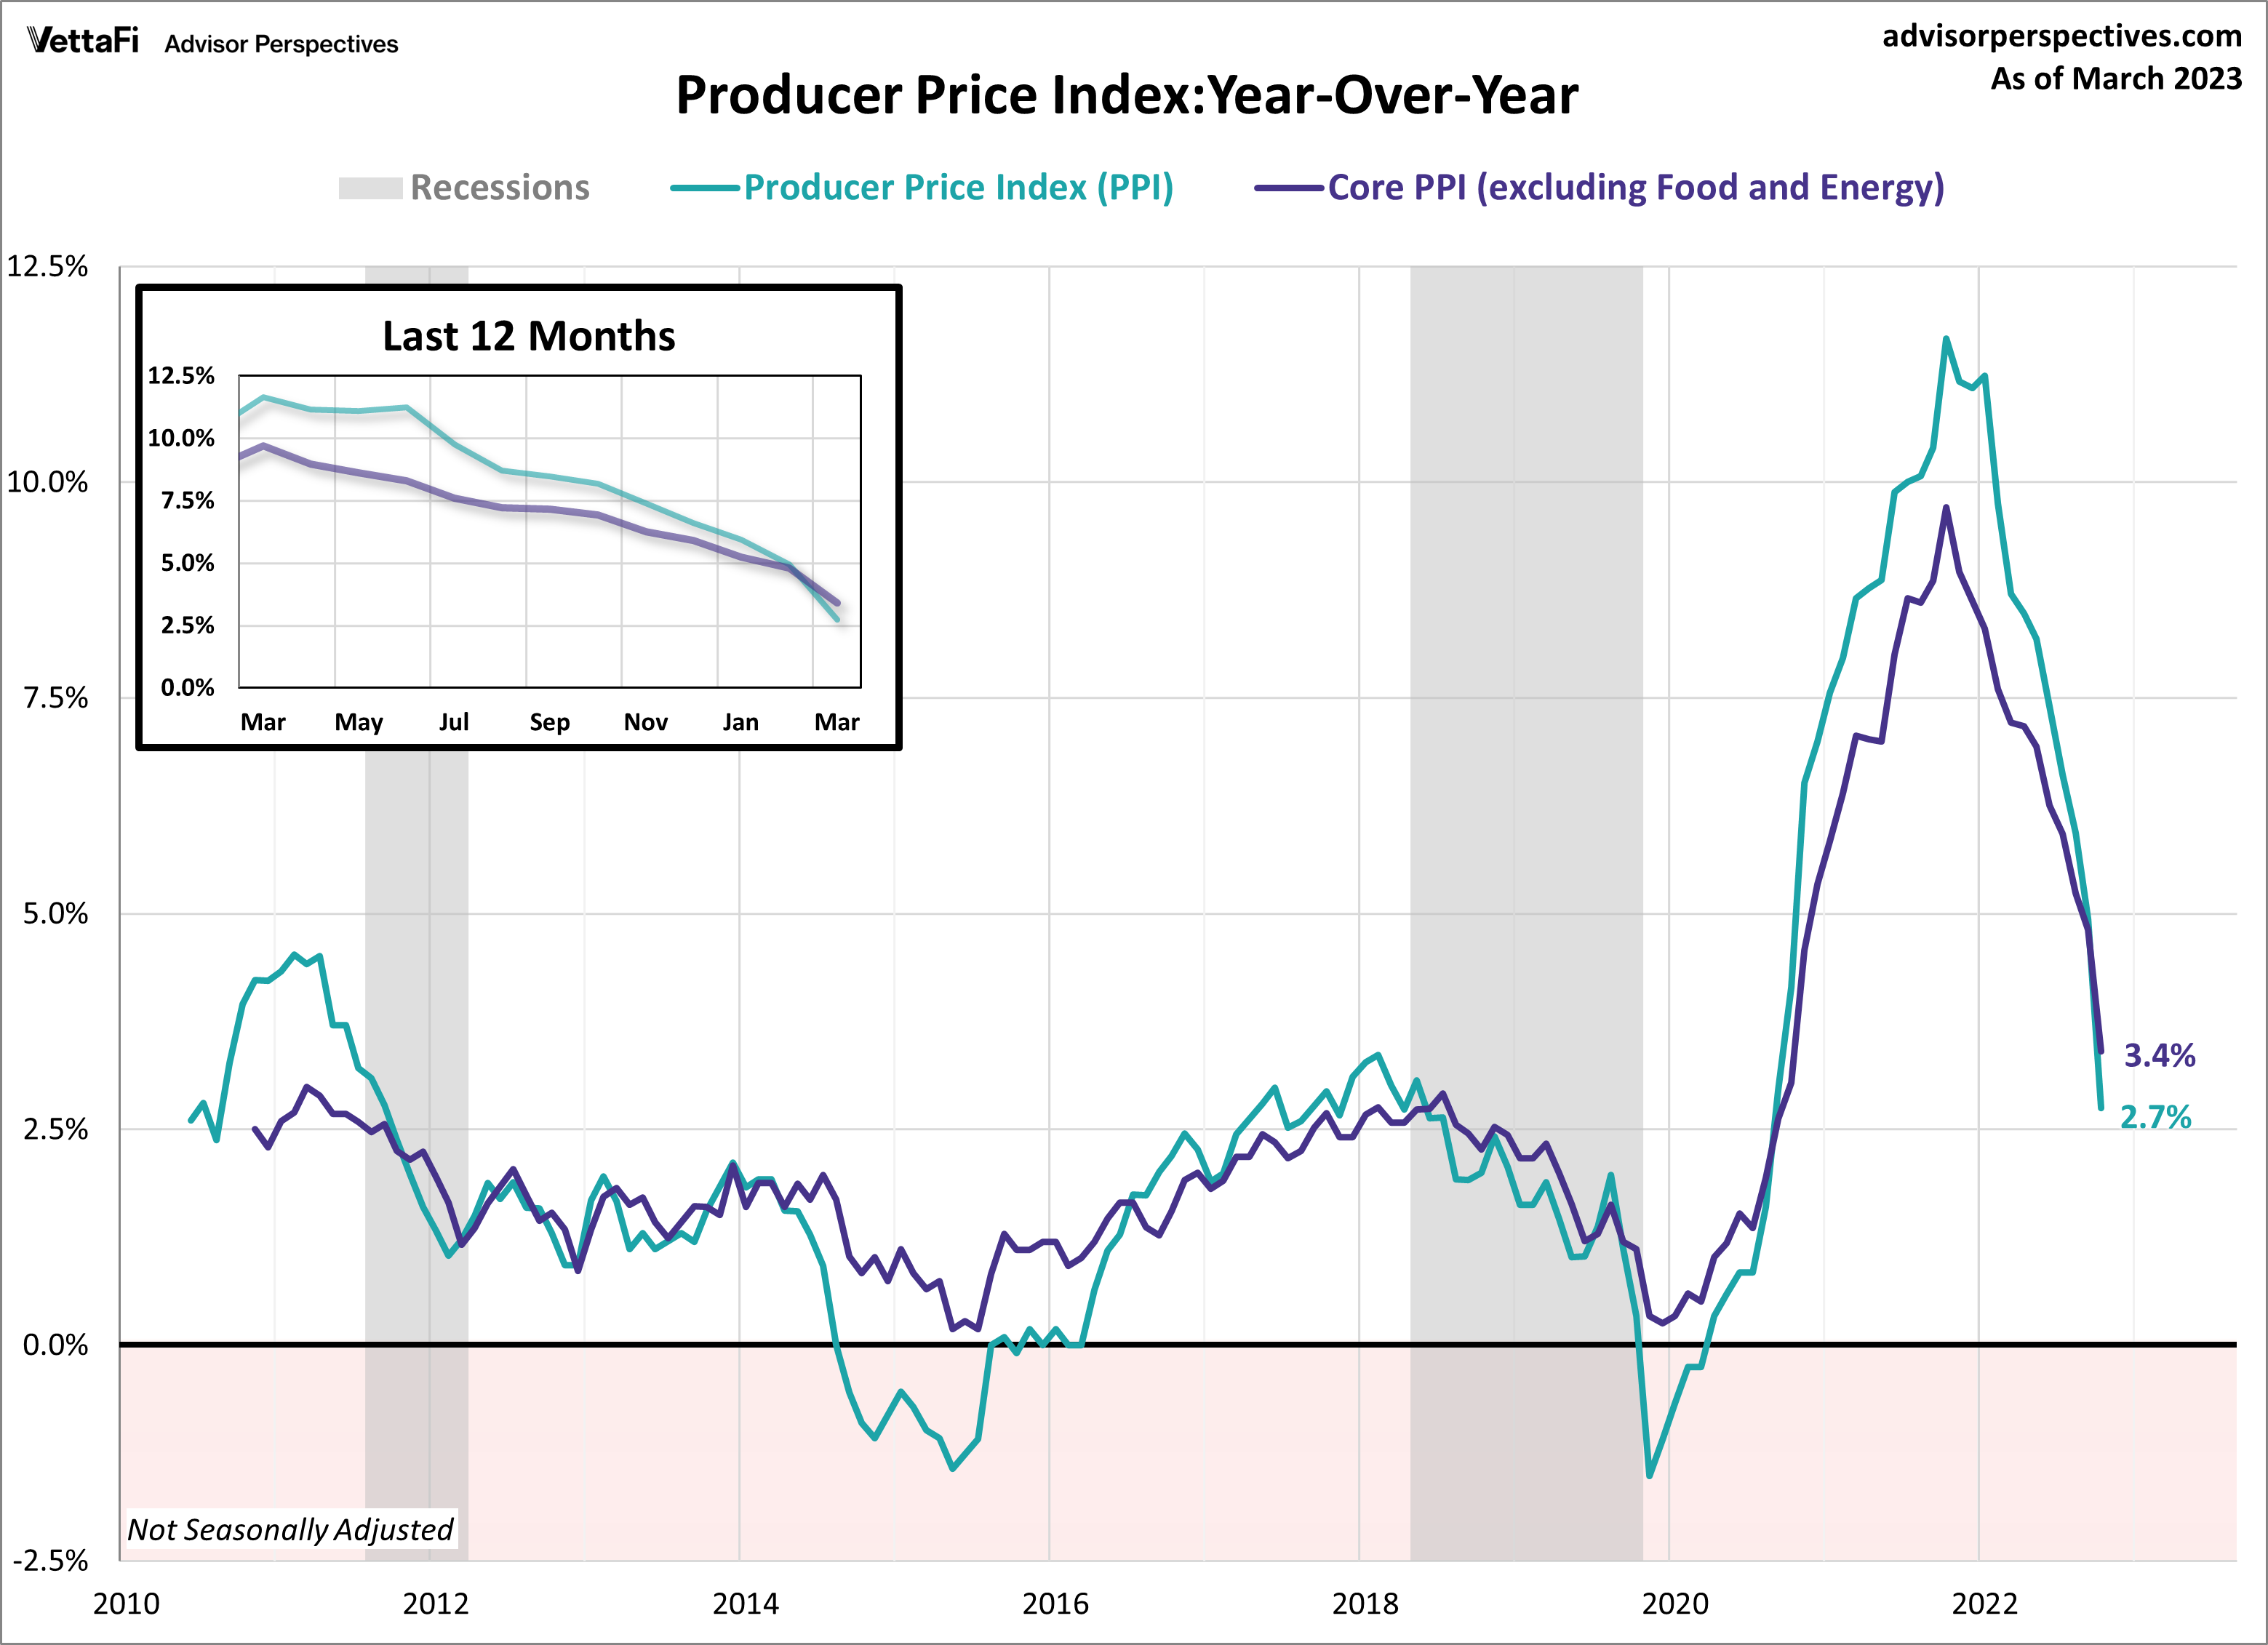
Producer Price Index (PPI)
The producer price index (PPI) for March revealed an unexpected fall in wholesale prices of 0.5% compared with a 0.0% change the previous month, the largest monthly drop in almost three years. On an annual level, prices rose by 2.7%, the lowest 12-month increase since January 2021. Expectations were for PPI to rise 0.1% from last month and 3.0% over the year. Core PPI (excluding food and energy) showed its largest monthly decline in producer prices since late 2019 by dropping 0.1% from February, down from a 0.2% increase last month and below the expected 0.3% increase in prices. Additionally, core prices increased as expected by 3.4% compared to the same time last year, down from February’s 4.9% increase. PPI is thought to be a leading indicator of consumer inflation since producers pass along their price shifts to the consumer level, so this month’s numbers indicate that the downward trend in inflation at the wholesale level could eventually lead consumer inflation to follow suit.
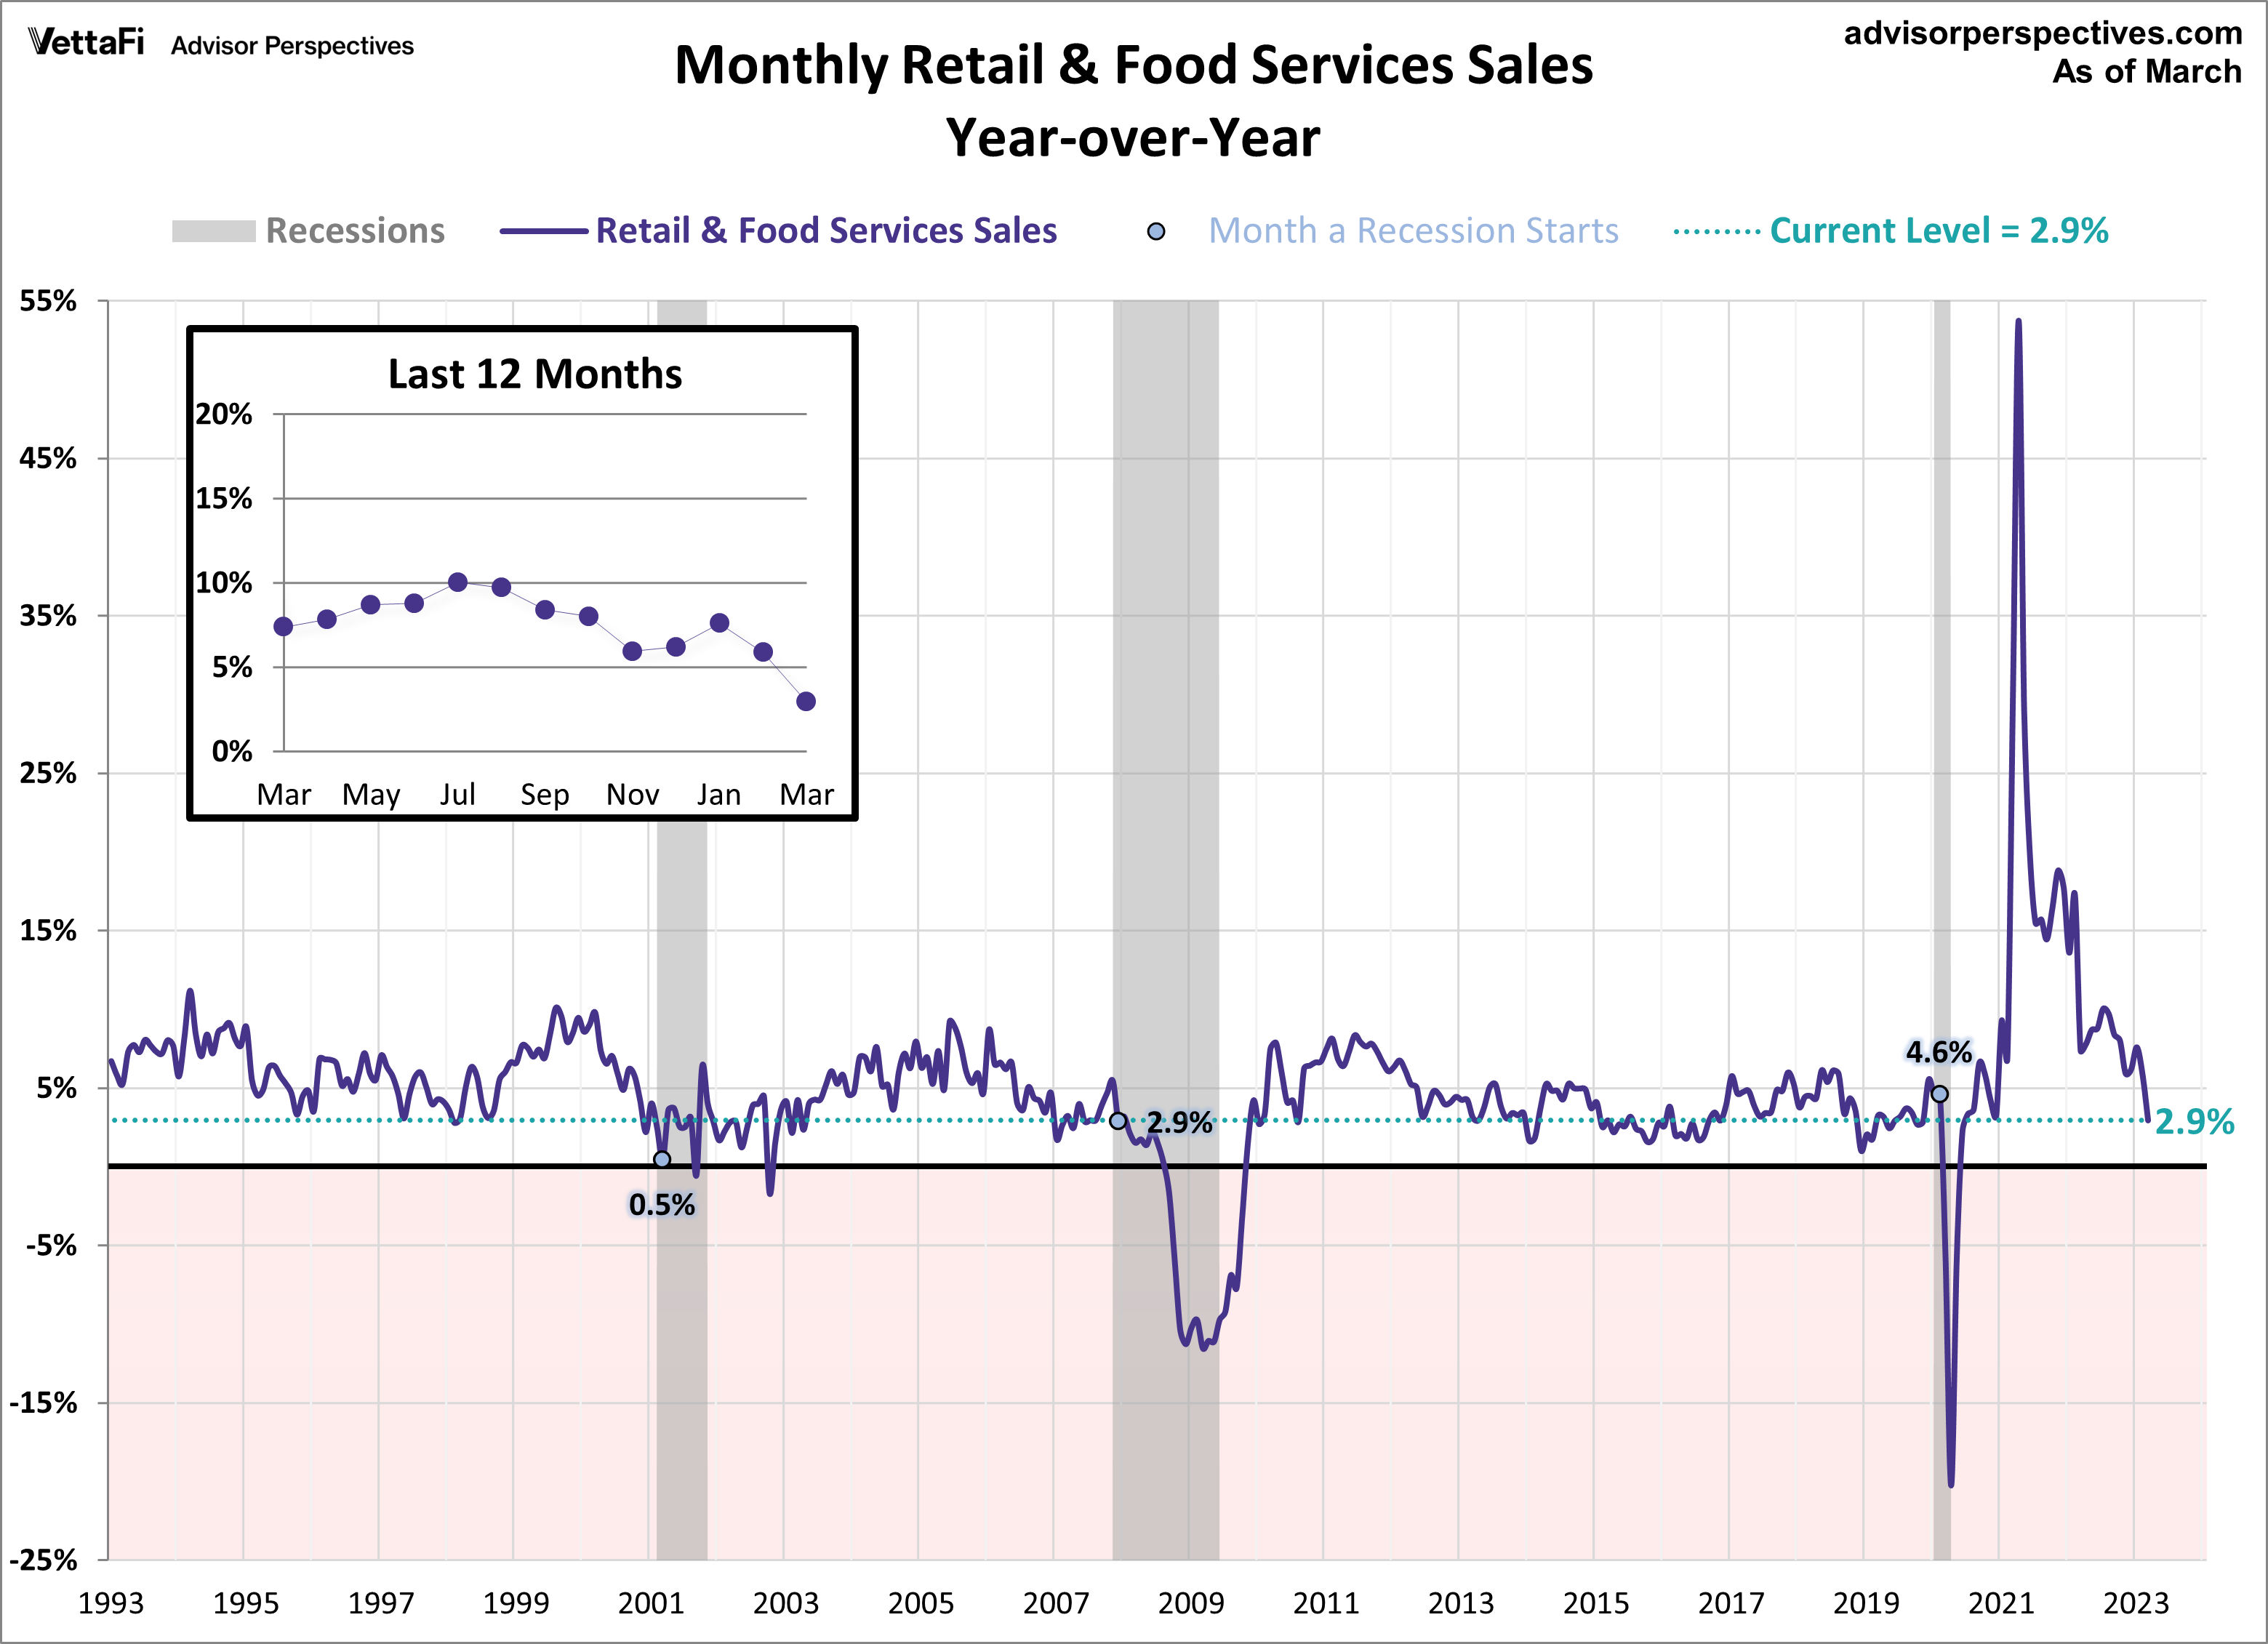
Retail Sales
Consumers continued to cut back on purchases in March as the latest report showed that retail sales fell 1.0% from February, more than the expected 0.4% decline. This marks the fourth monthly pullback in spending in the last five months, evidence that consumers continue to be cautious about inflation and increased interest rates. Spending was up 2.9% compared with March 2022, the smallest 12-month increase since June 2020. Core retail sales (excluding automobiles) were down 0.8% from last month and control purchases, thought to be an even more “core” view of retail sales, were also down 0.3% from last month. Retail sales will have an impact on the interest in the SPDR S&P Retail ETF (XRT).
This week, we will be closely monitoring updates on the housing market to see if it has maintained its momentum over the last month. On Tuesday and Thursday, the latest data on building permits, housing starts, and existing home sales for March will be released. Analysts predict that all three indicators will drop from February’s strong showing, with building permits forecasted to have the biggest drop. Building permits are forecasted to come in at a seasonally adjusted annual rate of 1.34 million, down from 1.55 million, while housing starts are expected to fall to a seasonally adjusted annual rate of 1.40 million, down from 1.45 million in February. Finally, existing home sales are projected to come in at a seasonally adjusted annual rate of 4.49 million units, down from 4.58 million in February. These housing market indicators will have an impact on home builders and residential real estate ETFs such as iShares U.S. Home Construction ETF (ITB), SPDR S&P Homebuilders ETF (XHB), and iShares Residential and Multisector Real Estate ETF (REZ).
For more news, information, and analysis, visit our Portfolio Strategies Channel.
