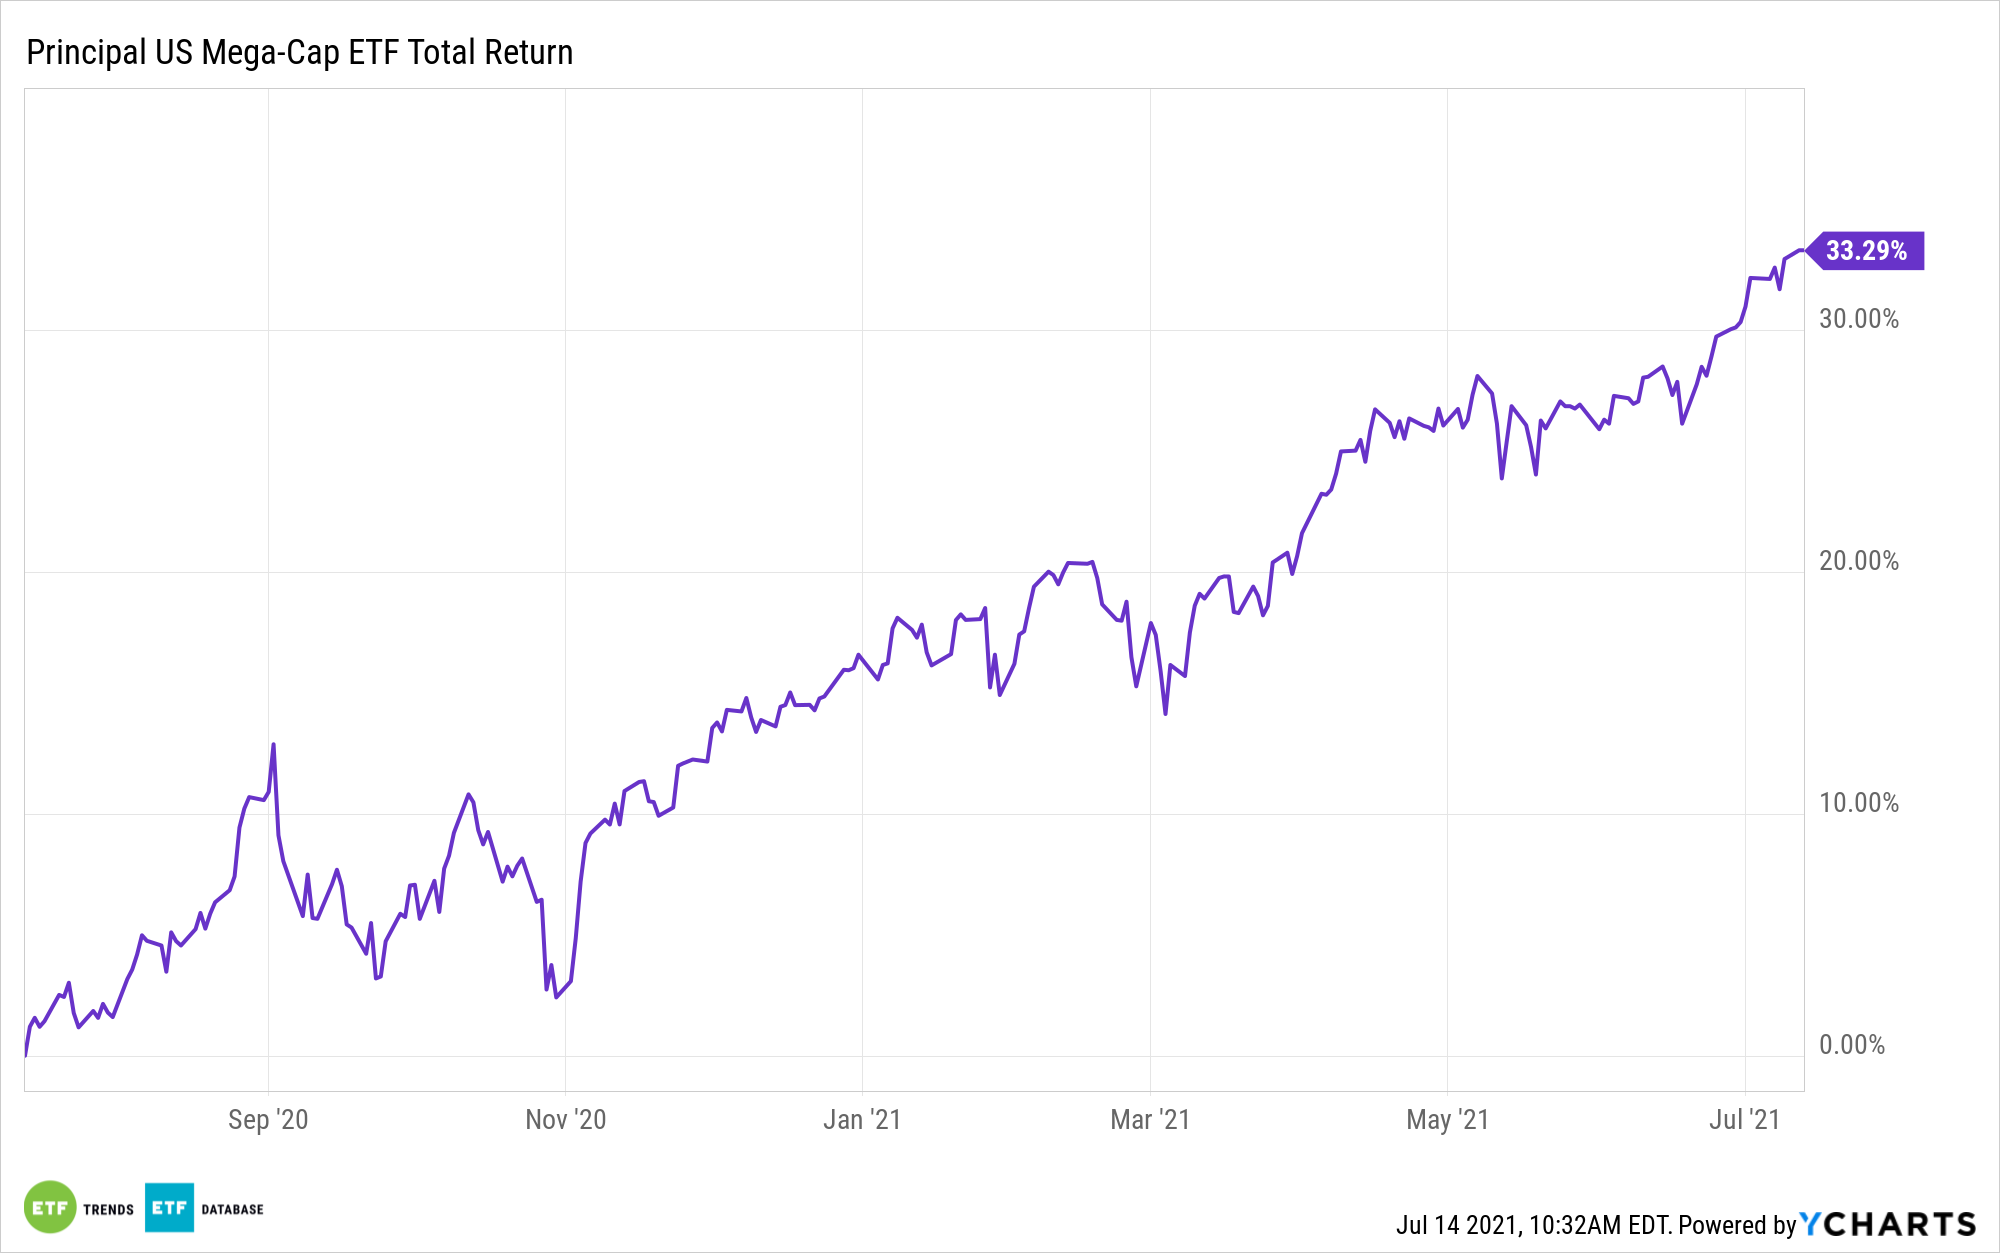
On Tuesday, the S&P and Nasdaq indices hit new record highs as mega-cap stocks pushed even higher, according to Reuters. The technology sector saw a 1.1% bump to hit a new peak, from which the tech-heavy Nasdaq benefited.
With consumer prices continuing to rise in June, the greatest growth in 13 years, the 10-year Treasury yield declined. This boosted the growth thesis, as mega-cap growth stocks profited.
As earnings reports have started to come in, anticipation of positive numbers could continue to drive growth and performance within the indices.
“Largely, the earnings strength is baked into equity valuations and if earnings continue to surprise on the upside, or elevated expectations, that should be positive for equities,” said Jon Adams, senior investment strategist at BMO Global Asset Management.
Capturing the Mega-Cap Movements with USMC
The Principal U.S. Mega-Cap ETF (USMC) tracks the Nasdaq US Mega Cap Select Leaders Index, a modified equal-weighted index.
The smart beta index takes the top half of securities on the Nasdaq US 500 Large Cap Index and divides the top 10% of companies by market value from the bottom 90%. The top 10% companies are weighted by market value, while the bottom 90% are equal-weighted and tilted toward those firms with less volatility.
The index is rebalanced semi-annually, though securities that become ineligible for the index between balancing periods are removed without being replaced.
As a smart beta ETF, USMC’s benchmark seeks to provide optimal outcomes on downturns and to capitalize on surges while minimizing exposure to volatility.
USMC is currently comprised of 48 holdings. By weight, the top five holdings are: Apple (AAPL) at 6.06%; Pfizer (PFE) at 3.16%; Berkshire Hathaway (BRK.B) at 3.16%; PepsiCo (PEP) at 3.05%; and McDonalds (MCD) at 3.03%.
USMC generally limits its sector and industry concentrations to no more than 25% of the portfolio. Currently, the fund has 25% of its portfolio allocated to technology, 21% to healthcare, 15% to communication services, and 14% to financial services.
The ETF carries an expense ratio of 0.12%.

For more news, information, and strategy, visit the Nasdaq Portfolio Solutions Channel.

