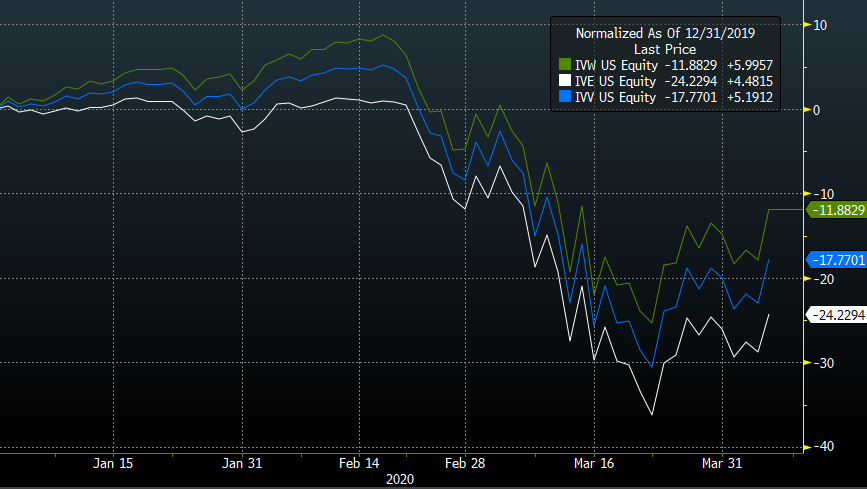
An emerging story in this crazy, hyper-volatile market, has been the disparate performance of various factors. Small cap and Value, in particular, have not delivered as advocated might have hoped, with both suffering so far this year. Twitter seems to be full of charts like this one today, comparing the two halves of the S&P 500 from an ETF perspective:

Source: Bloomberg, as of 4/7/2020
In this case, using the popular iShares ETFs, you can see that the growth version of the S&P 500, IVW, is only down just under 12% for the year, where the value version, IVE, is down over 24%. That’s frankly an enormous performance dispersion in factor land. And yet many folks who send me notes seem to think that things like Value and Growth are some kind of externalized forces. A sort of mana handed down from the finance gods, unknowable and untestable, when at the end of the day, it always comes down to the simple choices made by a model based on some data: buy this, don’t buy that.
So what’s actually going on under the hood? The S&P Growth methodology (which is pretty similar to most firms’ growth methodologies) looks at three primary data sets to decide how growth-y a company is: Sales Growth, Earnings Growth, and Price Momentum. These three metrics slice off about 50% of the S&P 500, and leave you with a portfolio that looks like this, from a sector perspective:

Source: Bloomberg, as of 4/7/2020
At first blush, it would seem like these tilts could explain most of the performance differential. The growth fund is light Financials, Energy and Health Care, and overweight Consumer Discretionary, Communications Services, and Tech. Anyone who’s been paying attention for the past month understands that these were the “correct” bets. But it’s just as important to see what’s going on inside those buckets.

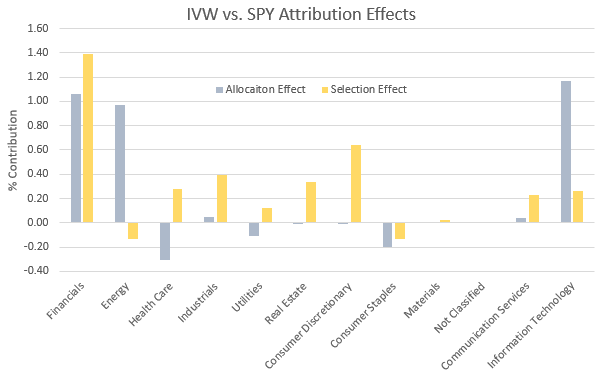
Source: Bloomberg, as of 4/7/2020
The differences here are pretty stark. With Financials, yes, the growth index (and thus IVW, VOOG, and SPYG, which all track the same index), not only owns a lower percentage weight in financial stocks than the S&P 500 (the allocation effect), it also benefits strongly from which financial stocks it maintained exposure to vs. the benchmark (the selection effect). After all, 5% of the growth index is still in financials — it just skips almost everything except for JP Morgan Chase, MSCI, and a handful of brokerage, exchange, and asset management stocks. Similarly, the small overweight in Consumer Discretionary stocks doesn’t matter much. It’s the indexes overweights in Amazon (a 6% position) and Home Depot that move the needle. On the other hand, stock selection inside IT seems irrelevant compared to the sector overweight.
But since this is supposed to be a factor-based fund, perhaps the most telling lens to look through is a risk model, where we can assess how much of a portfolio’s active risk comes from different factors.

Source: Bloomberg, as of 4/7/2020
This, from Bloomberg’s risk model, shows the beta of IVW and SPY to each U.S. equity factor – that is, relative to the entire U.S. Market. You can see on the right, they’re both hugely exposed to Size as a factor relative to the market, and that’s not surprising, after all, the S&P 500 is a Large/Mid cap index, and the growth index is even more Large Cap than the S&P 500 itself. From there, it’s clear that the growth methodology is not only providing exposure to growth, momentum, earnings, and profitability (all explicitly in the indexes objective), but it also has substantial negative exposure to Value beta, relative to the total market. That’s a long-winded way of saying, “it’s doing what it says on the tin.”
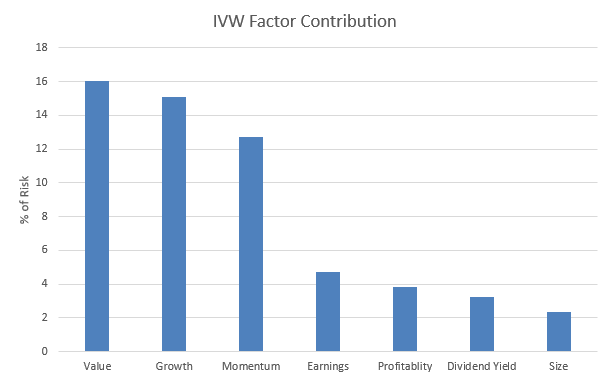
The question then becomes which of these tilts from the broad market really matter, and the answer is clear:

Source: Bloomberg, as of 4/7/2020
While I expected the “negative value” bar here, I was personally surprised at how strong the influence was. The moral of the story to me here is pretty simple: we’re in a down market, despite the recent rally, and there’s nothing so powerful as avoiding losses. Strangely, that’s really what growth has been doing for you lately.
For more market trends, visit ETF Trends.

