
By Frank Holmes, CEO and CIO, U.S. Global Investors
Investors are betting on growth stocks over value stocks by a wider spread right now than at any other time since at least 1990, including during the tech bubble.
The ratio between the Russell 1000 Growth Index and Russell 1000 Value Index reached a series high of 1.70 on May 15. That’s above the previous record of 1.68 set in March 2000, when the market peaked before plunging 50 percent.

Here’s another way to look at it: So far this year, growth stocks are up 1.8 percent through May 27. Meanwhile, value stocks are still down more than 16.2 percent.
What this suggests to me is that investors are seeking companies that are forecasting faster-than-average profits in an effort to recoup the losses they may have seen between February 19 and March 23 of this year.
As the name implies, growth companies are those that may be growing at a faster rate than the overall market. Although there are exceptions, they tend to have lower dividend yields than value stocks because they’re reinvesting their current revenue toward expanding their businesses. Growth names can appear in any sector or industry, but they’re more prevalent in biotechnology, data processing, health care equipment and other cutting-edge industries.
Value stocks, on the other hand, are those that appear to be undervalued relative to their peers. They often have attractive dividend yields and low price-to-earnings (P/E) ratios. Growth stocks currently have a very high P/E ratio of 29.36, whereas value stocks look more affordable at 16.38. Think banks, energy and utilities.
Keep a Long-Term Horizon
For many investors, the strategy of rotating heavily into growth stocks may make a lot of sense. Economic sentiment is starting to shift on reopening optimism and hopes that a coronavirus vaccine will be developed sooner rather than later.
But for others, especially those seeking income, value stocks may have more long-term benefits.
Here at U.S. Global Investors, we prefer GARP investing, or growth at a reasonable price, which combines characteristics of both growth and value investing. GARP was the investment style favored by legendary money manager Peter Lynch, who delivered a remarkable compound annual growth rate (CAGR) of 29 percent between 1977 and 1990.
We also don’t try to time the market, which often gets investors in trouble. Instead, we take a more long-term approach, focusing on high-quality stocks with strong fundamentals.
Take a look at the chart below, which shows you the S&P 500’s percent change from 10 years earlier. Since the mid-1930s, there have been only three major instances when the S&P delivered negative returns over a 10-year period, the two most notable being the Great Depression and the Great Recession.

The takeaway here is that a long-term investment strategy has historically succeeded in building wealth. In all but three time periods over the past 80+ years, had you bought high-quality S&P stocks and held them for at least 10 years, you were much more likely to see a decent return on your investment than trying to time the market.
In fact, the average return over any 10-year period was 90.2 percent—nearly double the initial investment.
Stay Diversified
Investors with a long-term horizon should also ensure they are diversified in a range of equities and bonds. The classic allocation is 60 percent stocks, 40 percent bonds, but that’s a decision you must make based on your age, risk tolerance and investment goals.
The chart below, courtesy of JPMorgan, shows you the average one-year, five-year, 10-year and 20-year returns for three different portfolios—one that consists only of stocks, another of bonds and one that has a 50/50 mix of stocks and bonds.
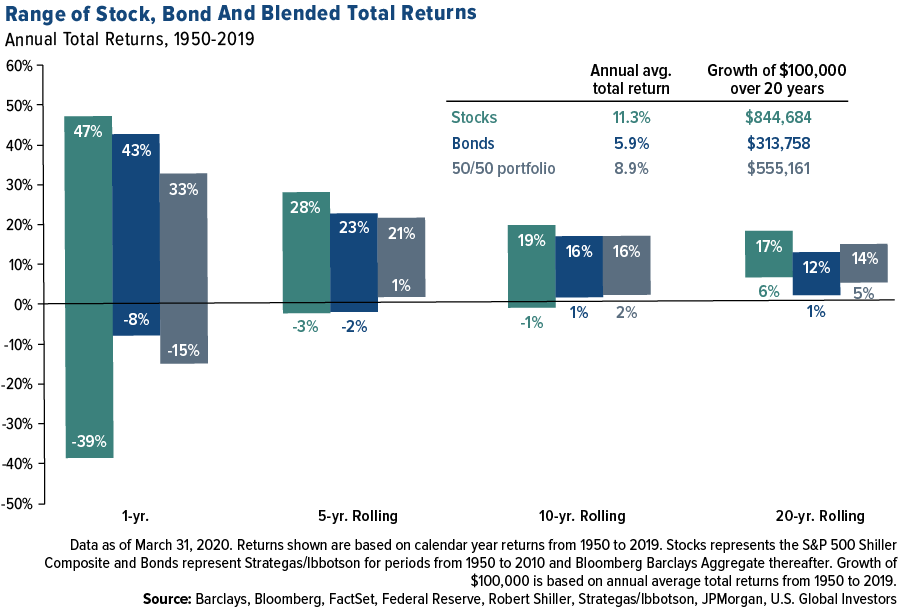
As you can see, stocks in the short term could potentially deliver total returns as high as 47 percent—or losses that were nearly as much. The volatility could be minimized with an allocation to fixed-income, a benefit that could be seen in the longer investment periods. The 50/50 blended portfolio was the only one that delivered positive returns in the five-year, 10-year and 20-year rolling periods.
Again, 50/50 may not be suitable for you, so use the chart simply as a general illustration of the benefits of diversification.
Those benefits may be improved even more with a 10 percent weighting in gold—with 5 percent in physical gold, the other 5 percent in gold mining stocks. For more on why an investment in gold may make a lot of sense right now, read my recent post, “You Can’t Just Print More Gold,” by clicking here.
The Russell 1000 Growth Index measures the performance of those Russell 1000 companies with higher price-to-book ratios and higher forecasted growth values. The Russell 1000 Value Index measures the performance of those Russell 1000 companies with lower price-to-book ratios and lower forecasted growth values. The S&P 500 is widely regarded as the best single gauge of large-cap U.S. equities and serves as the foundation for a wide range of investment products. The index includes 500 leading companies and captures approximately 80% coverage of available market capitalization. The Bloomberg Barclays U.S. Aggregate Bond Index is a broad-based flagship benchmark that measures the investment grade, U.S. dollar-denominated, fixed-rate taxable bond market. The index includes Treasuries, government-related and corporate securities, MBS (agency fixed-rate pass-throughs), ABS and CMBS (agency and non-agency).
The dividend yield, expressed as a percentage, is a financial ratio that shows how much a company pays out in dividends each year relative to its stock price. The price-to-earnings ratio (P/E ratio) is the ratio for valuing a company that measures its current share price relative to its per-share earnings (EPS). The price-to-earnings ratio is also sometimes known as the price multiple or the earnings multiple.
Diversification does not protect an investor from market risks and does not assure a profit.
