
By Kevin Flanagan, Head of Fixed Income Strategy, WisdomTree Investments
Ah, remember the original Batman TV series? There was nothing like a good Riddler riddle for the dynamic duo. Well, the answer to my crack at it is pretty straightforward: the U.S. economy.
As I’ve blogged about before, there are a variety of economic indicators that have shown clear signs of a “V”-shaped recovery. The most noteworthy have been retail sales and various employment gauges, as well as both manufacturing and service-related survey activities. But the one everyone is waiting for is the measure for overall economic activity—real GDP.
After the end of 2019, the U.S. economy went straight into negative territory, as the pandemic-related shutdowns produced unprecedented contractions in activity. First up, Q1 2020 real GDP fell by -5.0%, and that was followed up by the unfathomable plunge of -31.7% in Q2. Most market participants have been of the mindset that this cratering of activity wouldn’t return to pre-pandemic levels until the end of 2021. However, something interesting may have happened, and it has raised the question of whether the economy can recover sooner than expected.
U.S. Real GDP
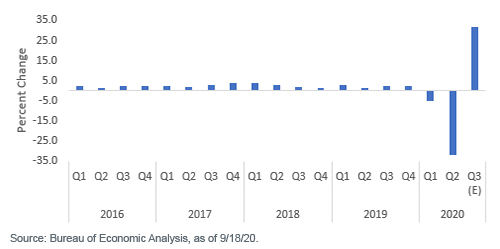
Based upon the Atlanta Federal Reserve’s (Fed) closely followed GDPNow forecast, Q3 real GDP is expected to reverse all of the second quarter’s record-breaking plunge. Indeed, the estimate as I write this blog post looks for a record-breaking gain of +32%. I thought it would be interesting to provide the reader with just what this looks like in two distinct types of graphs.
U.S. Real GDP
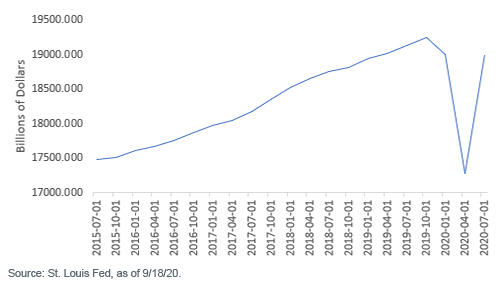
The bar chart reveals opposite mirror-like images for Q2 and Q3, while the line graph is an unmistakable “V.” However, what both graphs also show is that the U.S. economy would still not be quite back to pre-pandemic levels even if the aforementioned forecast does come to fruition. We still have that -5.0% Q1 contraction to overcome.
This is where things could get a little trickier. In our base case scenario, the economic recovery should continue, but forward progress may be more on the choppy side. Certainly, the Fed has underscored that their “pedal to the metal” monetary policy will remain in place, but how fast we get back to where we were to begin the year (and beyond) probably hinges on the fiscal side of the equation and, of course, the direction COVID-19 takes during the autumn and winter months.
Bond Market Implications
One thing is certain, though. If the Atlanta Fed is correct, the U.S. economy has made progress beyond anyone’s imagination just a few short months ago. What would the bond market think? Although this is not a riddle per se, it is a great question. Right now, the U.S. Treasury 10-year yield seems to have nestled into quite a comfortable trading range of roughly 0.50%–0.75%. For the record, the Q3 GDP report is not due out until October 29. (The final Q2 number comes out September 30.)
Let’s look at the “other side” of the current bond market trade. If growth can snap back earlier than expected, what happens if inflation returns more quickly than anticipated as well? In my opinion, this outcome is currently not priced in at all for the UST 10-year yield.
Unless otherwise stated, all data sourced is Bloomberg, as of September 18, 2020.
