
By Matt Wagner, CFA
Associate, Research
With the S&P 500 flirting with bear market territory, headlines are proclaiming a recession is priced in.
But at what probability?
High-yield credit spreads—commonly viewed as a leading indicator of economic slowdowns—have spiked higher by 112 basis points since the start of the year.
ICE BofA US High Yield Index Option-Adjusted Spread
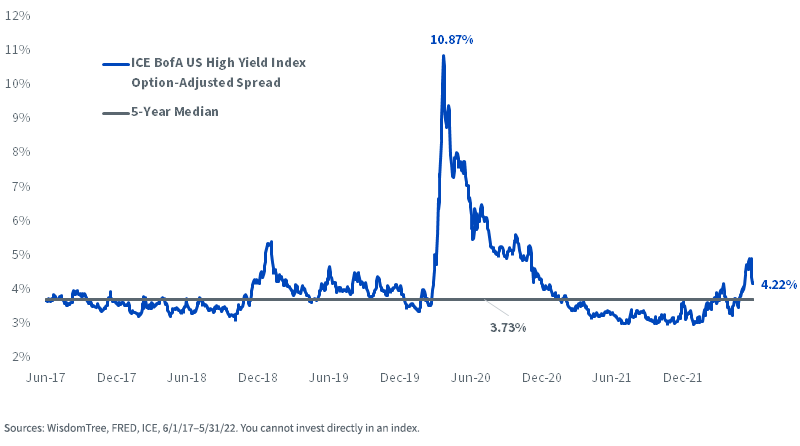
If we look to valuations on the S&P 500, the picture looks more benign, even after a decline of 14% from its high. Undoubtedly recession risk has picked up, but it seems to us far from a foregone conclusion.
The current forward price-to-earnings (P/E) ratio on the S&P 500 (17.9 times) sits above its 20-year historical median of 16 times. Assuming a recession began with the negative GDP growth in the first quarter and equities have eclipsed peak earnings for the cycle, one might expect a meaningfully lower multiple on the index.
For context, amid the recession induced by the global financial crisis, the average of the S&P 500 P/E ratio was a far lower 13 times.1
Going down the size spectrum in U.S. equities, valuations are signaling a far more dire outlook.
At the end of 2019, prior to the Covid-19 pandemic, the S&P 500 was trading at a modest P/E premium of 11% to the S&P 600.
Fast forward to May 2022 and the P/E on the S&P 500 is 17.9 times and the S&P 600, 11.7 times—a roughly 50% valuation premium for large over small. Historically, the S&P 500 has traded at a median 7% discount to the S&P 600 on P/E.
Relative Index P/E Multiples: S&P 500/S&P 600
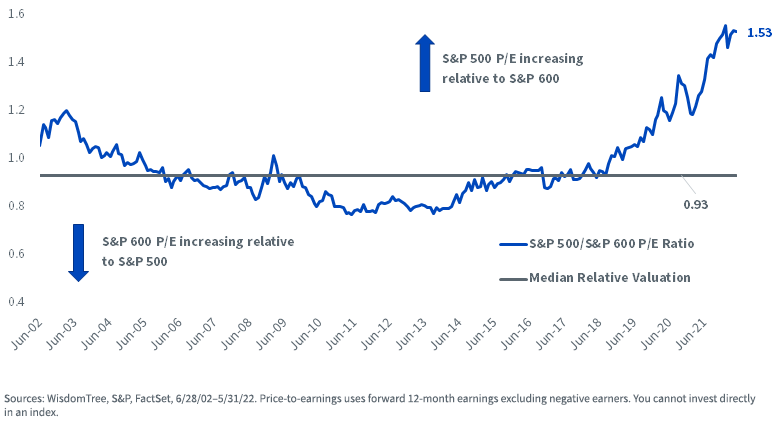
What seems clear to us is investors expect the challenge of the Federal Reserve successfully navigating a “soft landing” for the U.S. economy to weigh more heavily on small-cap earnings than large-cap earnings. As a result, valuations for small caps, relative to large caps, are more fully discounting a recessionary headwind.
For investors who a) are searching for attractive valuation opportunities and have a sufficiently long time horizon to withstand normal business cycle gyrations, or b) who assume a potential economic slowdown will be more mild than valuations imply, we would suggest an over-weight allocation to small caps.
Earnings Growth, Returns and P/E Multiples
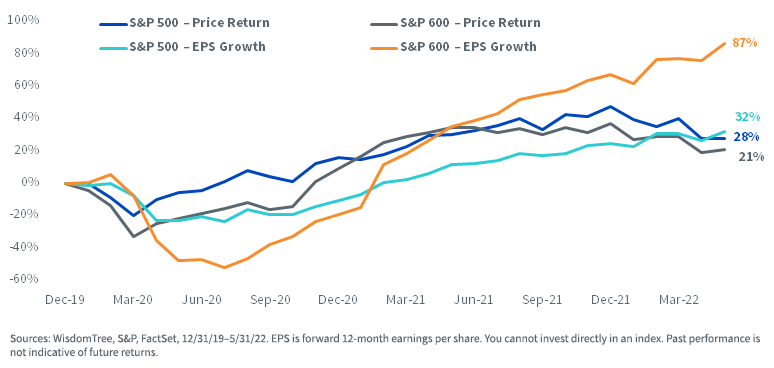
At the trough of earnings expectations in July 2020, estimated earnings on the S&P 600 had dropped by 50% from the end of 2019. S&P 500 estimated earnings were far more resilient, down just 25%.
While most investors are familiar with how select tech giants provided an earnings cushion for large-cap U.S. equities, fewer appreciate the sheer magnitude of the rebound in small-cap earnings.
S&P 600 forward earnings estimates are now 87% higher than at the end of 2019, and far higher than the 32% growth for the S&P 500.
Despite superior earnings growth, the S&P 600 return of 21% has lagged the 28% return of the S&P 500.
Index Returns and EPS Growth
Strong earnings growth has pushed down the multiples of both indexes. The S&P 500 multiple of 17.9 times is about 10% above its 20-year median P/E multiple but well below its 20-year peak of 23 times from July 2020.
S&P 500

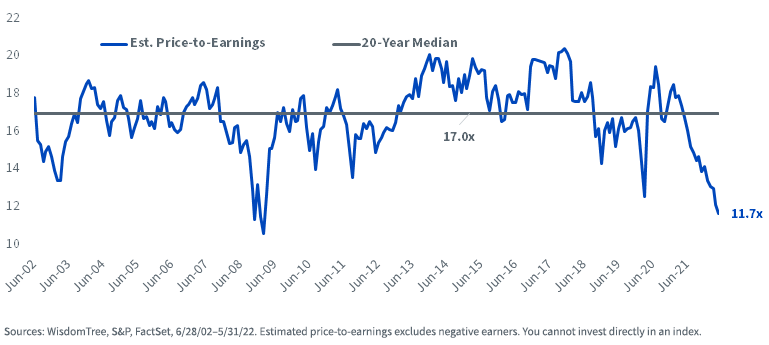
The S&P 600 P/E ratio of 11.7 times is a greater than 30% discount to its 20-year historical median P/E of 17 times.
The last time small-cap earnings multiples were this depressed was at the bottom of the global financial crisis in early 2009.
S&P 600
Conclusion
The valuation discount for small caps later in an economic cycle is not necessarily unexpected or unwarranted.
Small caps tend to have less diverse businesses than large caps and are more skewed toward economically sensitive sectors like Financials, Materials, Industrials and Consumer cyclicals that tend to have more volatile earnings growth.
Nonetheless, the dire outlook for small-cap earnings implied by valuations may be setting a low bar for small caps to beat—and for investors to prosper from.
Consider this excerpt from Abby Joseph Cohen, former senior investment strategist for Goldman Sachs and current Columbia Business School professor, in a recent Financial Times opinion piece:
Valuations are much less extreme than they were and, in some cases, reflect embedded expectations that are quite bleak. It may be less gut-wrenching to invest when the consensus outlook is for sunshine. But the best returns can occur when a less cheerful scenario is reflected in security prices.2
Trends in sector-level earnings growth will be the topic of the next post in a three-part series on small-cap valuations.
1 Using December 2007–June 2009 timeline for the Great Recession.
2 Abby Joseph Cohen, “Now is the time for stockpickers in markets,” Financial Times, 5/24/22.
Originally published by WisdomTree on June 2, 2022.
For more news, information, and strategy, visit the Modern Alpha Channel.
There are risks involved with investing, including possible loss of principal. Foreign investing involves currency, political and economic risk. Funds focusing on a single country, sector and/or funds that emphasize investments in smaller companies may experience greater price volatility. Investments in emerging markets, currency, fixed income and alternative investments include additional risks. Please see prospectus for discussion of risks.
Past performance is not indicative of future results. This material contains the opinions of the author, which are subject to change, and should not to be considered or interpreted as a recommendation to participate in any particular trading strategy, or deemed to be an offer or sale of any investment product and it should not be relied on as such. There is no guarantee that any strategies discussed will work under all market conditions. This material represents an assessment of the market environment at a specific time and is not intended to be a forecast of future events or a guarantee of future results. This material should not be relied upon as research or investment advice regarding any security in particular. The user of this information assumes the entire risk of any use made of the information provided herein. Neither WisdomTree nor its affiliates, nor Foreside Fund Services, LLC, or its affiliates provide tax or legal advice. Investors seeking tax or legal advice should consult their tax or legal advisor. Unless expressly stated otherwise the opinions, interpretations or findings expressed herein do not necessarily represent the views of WisdomTree or any of its affiliates.
The MSCI information may only be used for your internal use, may not be reproduced or re-disseminated in any form and may not be used as a basis for or component of any financial instruments or products or indexes. None of the MSCI information is intended to constitute investment advice or a recommendation to make (or refrain from making) any kind of investment decision and may not be relied on as such. Historical data and analysis should not be taken as an indication or guarantee of any future performance analysis, forecast or prediction. The MSCI information is provided on an “as is” basis and the user of this information assumes the entire risk of any use made of this information. MSCI, each of its affiliates and each entity involved in compiling, computing or creating any MSCI information (collectively, the “MSCI Parties”) expressly disclaims all warranties. With respect to this information, in no event shall any MSCI Party have any liability for any direct, indirect, special, incidental, punitive, consequential (including loss profits) or any other damages (www.msci.com)
Jonathan Steinberg, Jeremy Schwartz, Rick Harper, Christopher Gannatti, Bradley Krom, Tripp Zimmerman, Michael Barrer, Anita Rausch, Kevin Flanagan, Brendan Loftus, Joseph Tenaglia, Jeff Weniger, Matt Wagner, Alejandro Saltiel, Ryan Krystopowicz, Kara Marciscano, Jianing Wu and Brian Manby are registered representatives of Foreside Fund Services, LLC.
WisdomTree Funds are distributed by Foreside Fund Services, LLC, in the U.S. only.
You cannot invest directly in an index.
