
By Kevin Flanagan, Head of Fixed Income Strategy
Usually, when talking about the month of March, the old saying was whether it came and went as a lion or a lamb. Unfortunately, with the recent banking turmoil, a whole new dynamic was at play in 2023, and with it, the U.S. Treasury (UST) market experienced some unusual trading activity. We recently blogged about the elevated volatility quotient in Treasuries, but in this piece, I wanted to provide some perspective on what some key yields actually did during the month.
After looking at developments through the lens of a graph, all I could think about were the rollercoasters at Six Flags. Specifically, this analysis is going to focus on revisiting our good old friends, the 2-, 5- and 10-Year notes. Without a doubt, a choppy landscape was on display through January, but you got a sense that a trading range of some sort was still operative.
U.S. Treasury Yields
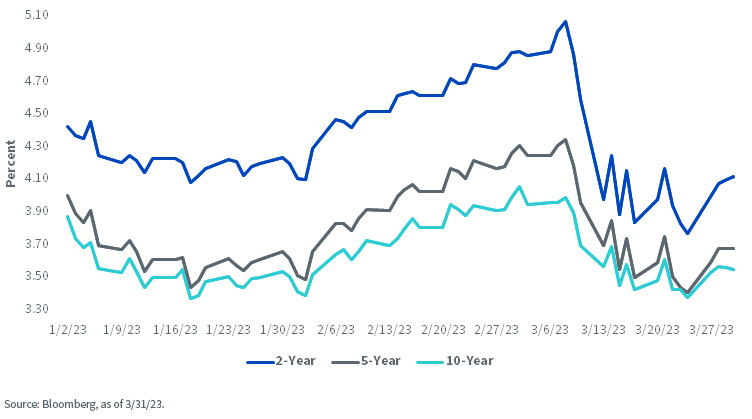
Then, following the Fed’s February 1 FOMC meeting, what was a seesaw type of pattern for yields moved in a decidedly upward trajectory, culminating with the recent peak readings following Chairman Powell’s hawkish semiannual monetary policy testimony in early March. To provide some perspective, in the intermediate to longer-dated sectors of the UST curve, the 5- and 10-Year yields rose by about 80 basis points (bps) and 65 bps, respectively, as economic/inflation data surprises had investors reevaluate their rate outlooks.
However, it’s the front end of the curve where even more visible yield movements have occurred. Indeed, the UST 2-Year yield surged by 70 bps in February and then tacked on another post-Powell increase of 25 bps (just under 100 bps in total) to reach a peak of 5.07% on March 8, the first time eclipsing the “5%” threshold since 2007. This spike reflected the possibility that the Fed could raise rates more than anticipated and was underscored by the implied probability for Fed Funds reaching almost 5.70% for September.
We all know what happened next, as the recent bout of banking turmoil turned the Treasury market upside down and created the rollercoaster trading pattern I mentioned earlier. All of a sudden, daily movements in the 2-Year of 20, 30 or 40 bps in yield were being observed. Of course, the Fed outlook shifted dramatically as well, with multiple rate cuts now being priced in beginning this summer. In fact, on March 24, the Fed Funds Rate was implied to come in at roughly 3.75% in January 2024, representing a 170-bp reversal from earlier in March. Needless to say, the UST 2-Year yield followed suit and plunged to 3.55% on an intraday basis, an incredible decline of more than 150 bps in an instrument that is typically viewed as being less volatile due to its shorter duration profile.
Conclusion
That was then; what about what lies ahead? Great question. One thing that does seem probable is that the volatility quotient will remain elevated. However, if the headlines surrounding the banking turmoil simmer down, yield movements will more than likely not be as extreme as we witnessed in March. Last week, I blogged about the Fed’s lending facilities, and the good news is that the total usage amount for the week ending March 30 dropped by -$189 billion. Hopefully, the UST market can get back to focusing solely on the fundamentals, such as the upcoming jobs and inflation reports, and of course, the ever-present “will they or won’t they” when it comes to the May FOMC meeting.
Originally published 05 April 2023.
For more news, information, and analysis, visit the Modern Alpha Channel.
