The momentum factor is alive and well, reaching levels of outperformance this month despite languishing for much of the first quarter. According to research data as of April 24, the underlying index in the Invesco S&P 500 Momentum ETF (SPMO) is having its best month since launching in November 2014.
Key Takeaways
-
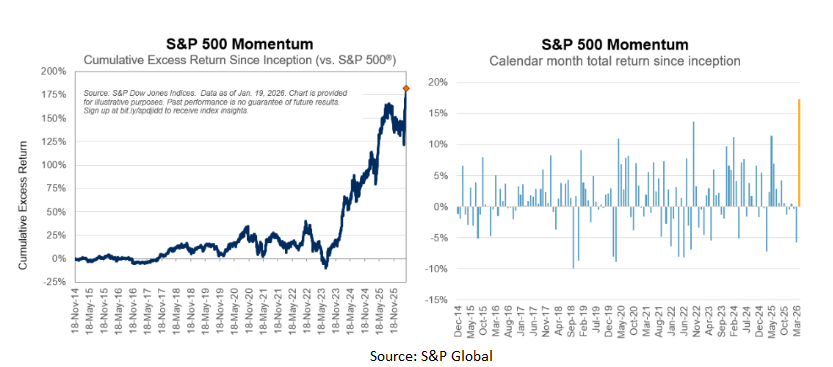
The S&P 500 Momentum Index is on track for its best month since its 2014 inception, posting a 17.3% total return and hitting a record 182% cumulative excess return.
-
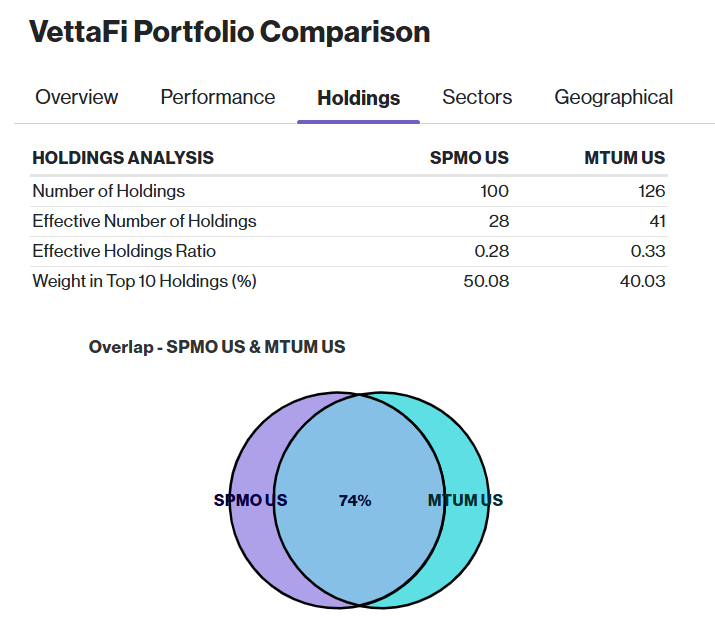
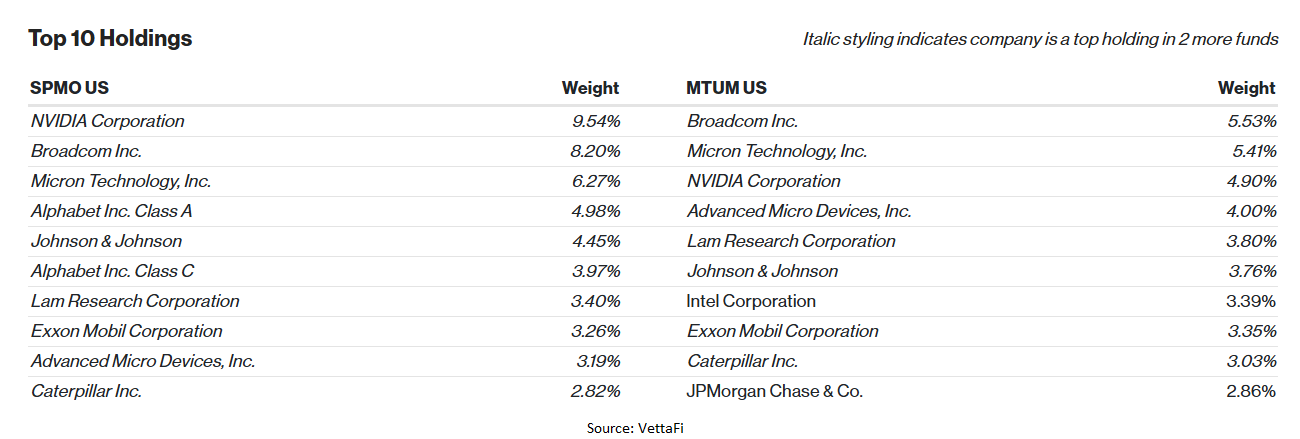
SPMO offers higher conviction and semiconductor concentration, with its top 10 holdings making up over 50% of the fund and nearly 24% allocated to its top three chip stocks.
-
While both funds are tech-heavy, MTUM provides broader diversification across 126 holdings and includes higher allocations to the financials and consumer discretionary sectors.
Awe-Inspiring April
The S&P 500 Momentum Index surged to a month-to-date total return of 17.3% as well as an excess return of 7.5% as of last Friday. This rally pushed the index’s cumulative excess return since inception to a record high of 182%, according to S&P Global.
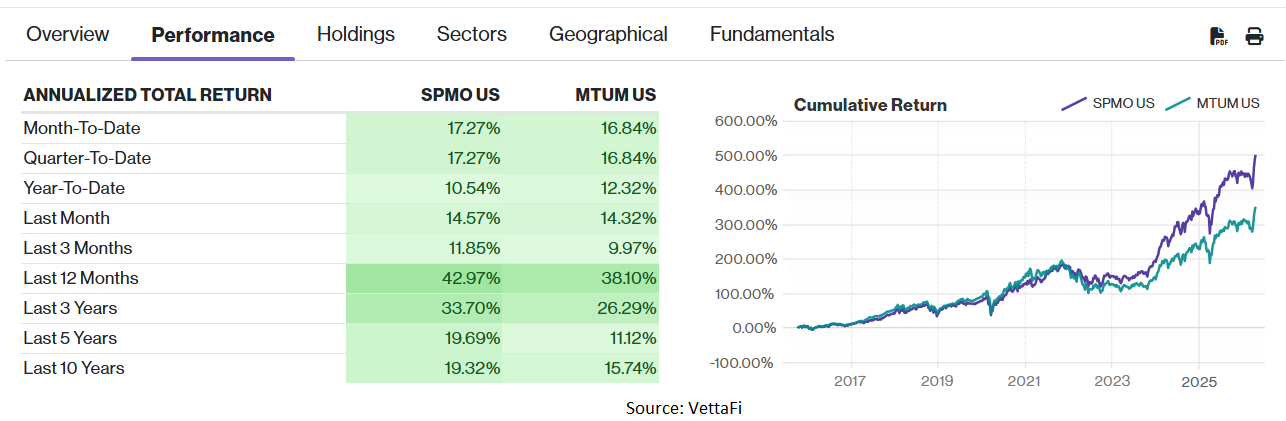
This momentous performance wasn’t isolated to SPMO. The iShares MSCI USA Momentum Factor ETF (MTUM) is up about 17% for the month as well.
As Newton’s first law of motion notes, a body in motion tends to stay in motion. It will be interesting to see if that applies to the momentum factor for the rest of the year, but in the meantime, it warrants a closer look at both SPMO and MTUM.
See More: Magnifying Momentum: Month-to-Date Direxion Inflow Leaders
Technically Speaking Sector-Wise
What’s behind the strong April for both funds? Technically speaking, tech. SPMO focuses on the S&P 500, targeting the highest-momentum stocks within this universe of large-cap names. As of the final week of April, its portfolio is heavily influenced by the technology sector strength.
As for MTUM, it casts a wider net that incorporates both large- and midcap U.S. stocks by tracking the MSCI USA Momentum SR Variant Index. Likewise, the fund holds significant positions in tech giants.
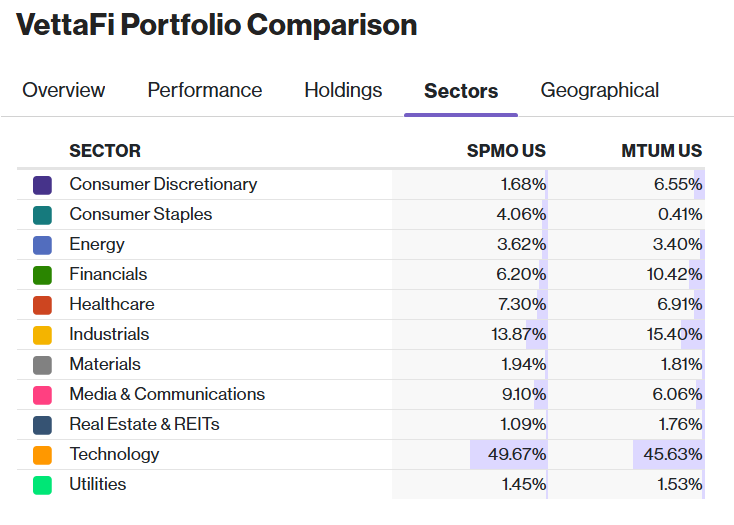
Comparatively, SPMO is much more concentrated in tech, making up nearly 50% of its total weight. This tech tilt is joined by industrials, which comprise 13.9% of the fund while media & communications at 9% rounds out the top three in terms of sector exposure.
In contrast, MTUM also adds heavy tech exposure with a 45.6% allocation. MTUM puts a heavier allocation into industrials at 15.4% while upping the ante on financials with a 10.4% weight. It’s also allocating more to consumer discretionary at almost 5% higher versus SPMO. Notable on the SPMO side is the higher allocation to consumer staples, at 4.06%, and the aforementioned media & communications sector, at 9%.
The Individual Holdings
Both portfolios are anchored by semiconductor giants, with Broadcom (AVGO), Nvidia (NVDA), and Micron Technology (MU) appearing as top-three holdings in both funds. SPMO places its largest bet on Nvidia, at 9.54%, while MTUM favors Broadcom as its primary position, at 5.53%. The three semiconductor companies make up 24% of SPMO’s holdings, versus MTUM’s 15.8%. Investors bullish on chips may want to consider SPMO, and again, those wanting greater diversification may want MTUM.
See More: ETF of the Week: Invesco S&P 500 Momentum ETF (SPMO)
Return of Momentum?
As mentioned, momentum has struggled to find its footing amid shifting interest rate expectations and geopolitical uncertainty. However, the April surge could suggest a resurgence in the momentum factor, if macro conditions work in its favor for the rest of the year.
“Having lagged its parent index year-to-date as recently as April 2, Momentum’s turnaround has been spectacular,” S&P Global said, regarding SPMO.
Once momentum gathers strength, it can be difficult to slow down. This makes it a powerful engine for those who know riding the trends is a better proposition than standing in its way.
| Feature | Invesco S&P 500 Momentum ETF (SPMO) | iShares MSCI USA Momentum Factor ETF (MTUM) |
|---|---|---|
| Ticker | SPMO | MTUM |
| Issuer | Invesco | BlackRock (iShares) |
| Inception Date | October 9, 2015 | April 16, 2013 |
| Expense Ratio | 0.13% | 0.15% |
| Assets Under Management | ~$15.9 Billion | ~$23.4 Billion |
| Number of Holdings | 100 | 126 |
| Underlying Index | S&P 500 Momentum Index | MSCI USA Momentum SR Variant Index |
| Selection Universe | S&P 500 Index (Large-Cap) | MSCI USA Index (Large- & Mid-Cap) |
For more news, information, and strategy, visit ETF Trends.
