
Advisors and investors looking to capture potential tailwinds for small-cap stocks headed into 2025 would do well to consider active management. Given the disparities between top- and bottom-performing small-caps, strategies that target high-quality small-caps could prove beneficial.
Investors may be tempted to add a passive small-cap strategy to their portfolio and call it a day. However, a wild gulf of performance disparities exists within major small-cap indexes, according to Raheel Siddiqui, senior investment strategist at Neuberger Berman, in a recent blog post.
“If you split the small cap universe into profitable and unprofitable companies, two extremely different worlds emerge,” Siddiqui noted.
When looking back on a historical basis to 2004, profitable small-cap companies consistently beat their unprofitable peers by 6.5% annually. What’s more, the profitable companies within the Russell 2000 Index generated a median five-year beta of 0.97. That compares with a 1.32 beta for unprofitable small-cap stocks.
When screening for balance sheet strength, Neuberger Berman found the 400 companies within the Russell 2000 with the “most conservative” balance sheets closely mirrored the 200 companies within the Russell 1000 with the most conservative balance sheets. Additionally, the firm found high-quality small-caps generated greater free cash flow margins than the broad category. They also found that the top small-cap quintile’s FCF margins proved similar to the top large-cap quintile.
“Over the past 40 years, the Russell 2000 has delivered average earnings growth of 10% per year,” said Siddiqui. “However, we find that the earnings growth of profitable Russell 2000 companies averaged 54% per year versus 3% for the median company in the index.”
See also: Reallocate 1% of Your Large-Cap Exposure to Boost Returns 20%
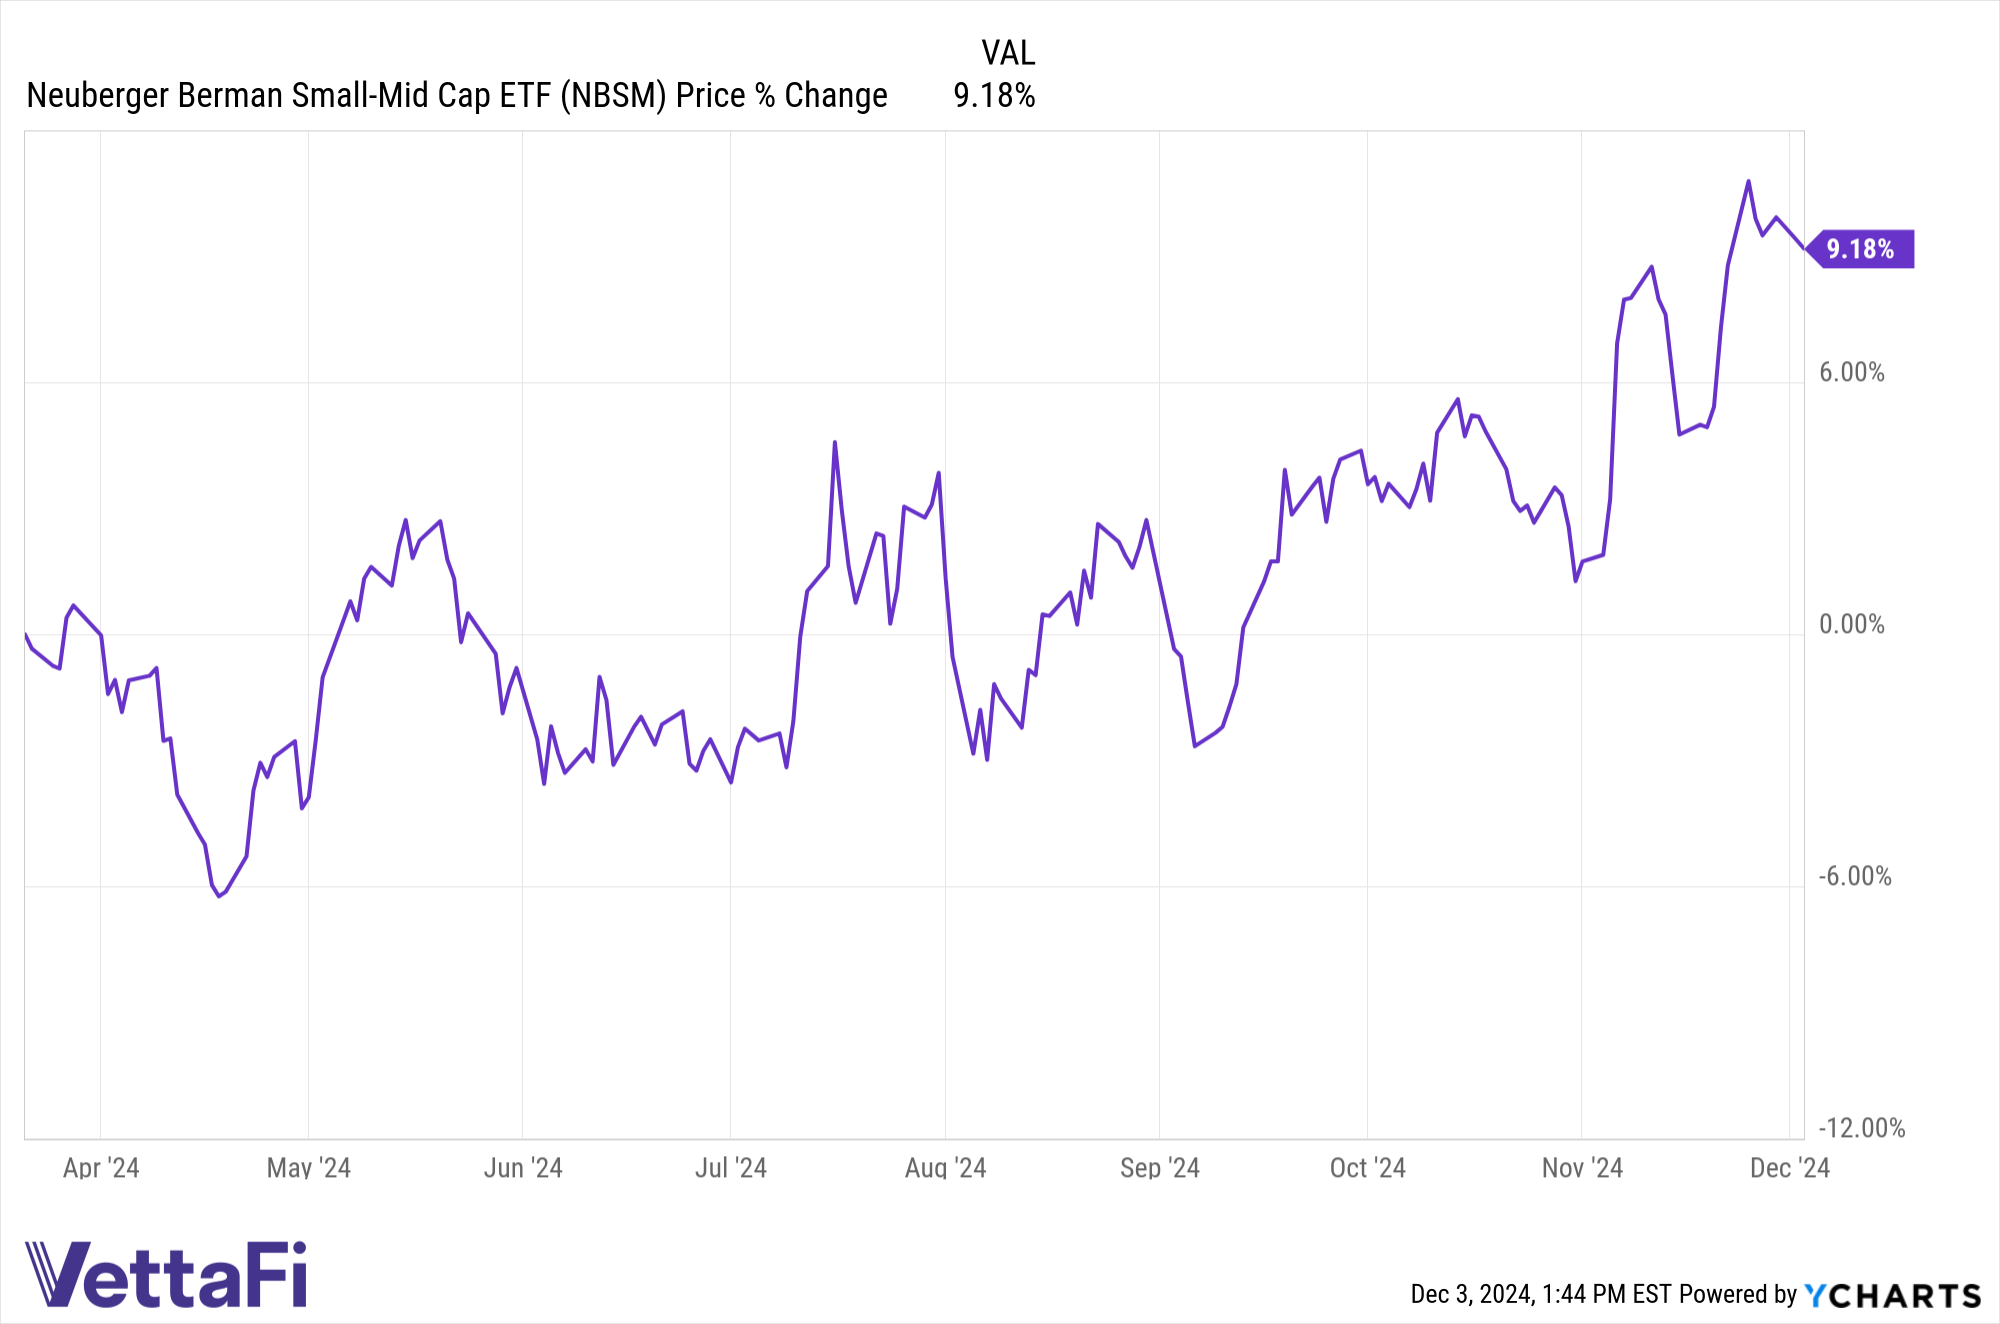
The performance disparities within small-caps creates a compelling argument for the benefits of active management. The Neuberger Berman Small-Mid Cap ETF (NBSM) is actively managed and invests in small- and midcap companies with elevated, sustainable growth potential.
The fund managers use bottom-up analysis when evaluating companies. The strategy focuses on quality companies that generate reliable free cash flow and elevated profitability. The companies also have conservative balance sheets and business models that set them apart from peers. The overall approach to SMIDcap investing results in a diversified portfolio compared to benchmarks.
The strategy also seeks to mitigate the elevated volatility inherent to small- and midcap investing while reducing downside risk. NBSM carries an expense ratio of 0.74%.
For more news, information, and analysis, visit the Invest Beyond Cash Channel.
