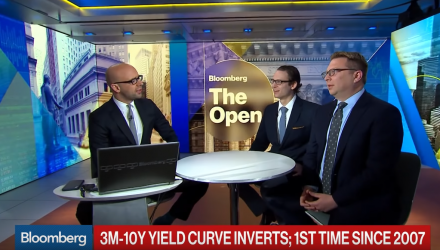
Fears of an inverted yield curve racked the markets during 2018’s fourth quarter sell-off, but they returned on Friday as the short-term 3-month and longer-term 10-year yield curve did as such–unveil an inversion that hasn’t been seen since 2007–just ahead of the financial crisis.
This helped send the Dow Jones Industrial Average south by over 300 points in Friday’s early trading session.
“Could it be that the yield curve is signaling weak global economic growth and low inflation without necessarily implying a recession in the US? We think so, and the US stock market apparently supports our thesis,” Ed Yardeni of Yardeni Research said in his morning note Friday. “So why are global stock markets also doing so well? Perhaps there is too much pessimism about the global economic outlook.”
The spread between the 3-month and 10-year notes fell below 10 basis points for the first time in over a decade. This strong recession indicator contrasted a more upbeat central bank on Wednesday, but investors were quick to sense the cautiousness.
During Wednesday’s interest rate announcement by the Fed, Chairman Jerome Powell gave mention to the strength of the economy, but did acknowledge that economic concerns exist domestically and abroad.
“We continue to expect that the American economy will continue to grow at a solid pace in 2019 although likely lower than the very strong pace in 2018,” said Powell. “We believe our current policy stance is appropriate.”
In the video below, Noah Weisberger, managing director at Sanford Bernstein, and Bloomberg’s Luke Kawa examine an inversion of the yield curve between U.S. 3-month and 10-year yields for the first time in more than a decade. They speak on “Bloomberg Markets: The Open.”
For more market trends, visit ETF Trends.


