
Treasury bonds registered an all-time high at the height of the Covid panic back in March 2020. But since then, the asset class has trended lower, largely due to stubbornly high levels of inflation. Even though inflation levels have come down significantly from their peak in June 2022, Treasuries* have struggled to sustain any sort of lasting bid.
Can the Fed Help Bond Markets?
In response to some of the highest inflation readings in decades, the Fed responded by embarking on one of its most aggressive tightening campaigns in history. It’s crazy to think that back in January 2022, the Federal Funds rate* was still hovering around zero. And now, not even a year and a half later, rates are hovering around 5%.
High inflation and rising rates are the kiss of death for bond markets. Not to mention, default risks rise in such an environment, as companies are forced to roll maturing debt over at higher rates of interest. This increases interest expense and can lower profit margins and earnings.
We’re starting to see the impacts of this permeate throughout the economy. The labor market is still showing resiliency, despite the pace of layoffs increasing. Additionally, Q1 gross domestic product (GDP) came in at 1.1%, which was below estimates of 2%.
The Fed’s strategy to curb inflation has been one of demand destruction. By increasing financing costs, consumption could ease. Keep in mind that consumption represents nearly 70% of GDP. Historically, Treasury markets tend to act as a safe haven during periods of economic slowdown. Traders that think the economy could be on the cusp of a recession may find an opportunity in Direxion’s Daily 7-10 Year Treasury Bull 3X Shares (Ticker: TYD), which seeks daily investment results, before fees and expenses, of 300% of the daily performance of the ICE U.S. Treasury 7-10 Year Bond Index*. There is no guarantee that the funds will meet their stated investment objective.
Below is a daily chart of TYD as of April 27, 2023.
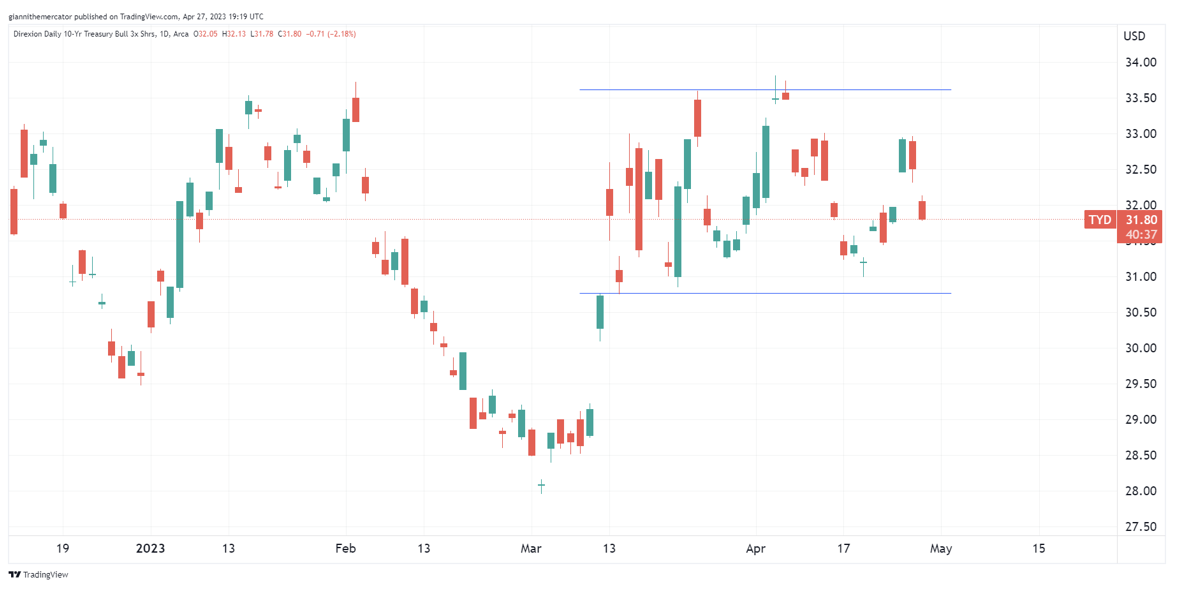
Source: TradingView.com
Candlestick charts display the high and low (the stick) and the open and close price (the body) of a security for a specific period. If the body is filled, it means the close was lower than the open. If the body is empty, it means the close was higher than the open.
The performance data quoted represents past performance. Past performance does not guarantee future results. The investment return and principal value of an investment will fluctuate. An investor’s shares, when redeemed, may be worth more or less than their original cost; current performance may be lower or higher than the performance quoted. For the most recent month-end performance go to Direxion.com/etfs. For standardized performance click here.
Inflation: The Skeleton Key
The Fed’s dual mandate is full employment and price stability. The economy is already at or near full employment, as we are near record-low levels of unemployment. Since the Fed already has that box checked off, their full focus and attention is directed towards inflation.
The next consumer price index (CPI)* report is set to be released on May 10. If it comes in above estimates, it could be a catalyst for bond markets to sell off, and for the Fed to stay on their hawkish course. The question is whether bond markets have fully priced in a “higher for longer” scenario. If not, then Treasuries could see another selloff.
In such a scenario, Direxion’s Daily 7-10 Year Treasury Bear 3X Shares (Ticker: TYO), which seeks daily investment results, before fees and expenses, of 300% of the inverse (or opposite) of the daily performance of the ICE U.S. Treasury 7-10 Year Bond Index, potentially could see a nice bid.
Below is a daily chart of TYO as of April 27, 2023.
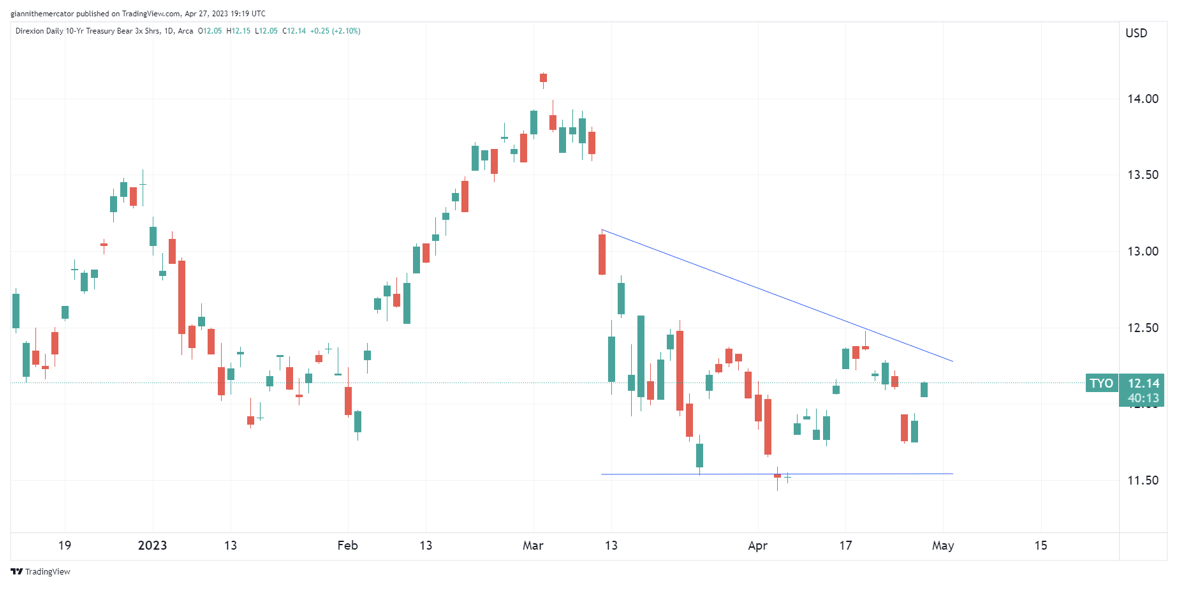
Source: TradingView.com
Candlestick charts display the high and low (the stick) and the open and close price (the body) of a security for a specific period. If the body is filled, it means the close was lower than the open. If the body is empty, it means the close was higher than the open.
The performance data quoted represents past performance. Past performance does not guarantee future results. The investment return and principal value of an investment will fluctuate. An investor’s shares, when redeemed, may be worth more or less than their original cost; current performance may be lower or higher than the performance quoted. For the most recent month-end performance go to Direxion.com/etfs. For standardized performance click here.
Additional Capital Market Opportunities
Traders looking for alternative means to speculate in capital markets may also consider Direxion’s Daily 20+ Year Treasury Bull 3X Shares (Ticker: TMF) and Daily 20+ Year Treasury Bear 3X Shares (Ticker: TMV), which seek to track investment results, before fees and expenses, of 300% or -300%, respectively, of the daily performance of the ICE U.S. Treasury 20+ Year Bond Index*.
Original Editor’s Note: Any and all references to time frames longer than one trading day are for purposes of market context only, and not recommendations of any holding time frame. Daily rebalancing ETFs are not meant to be held unmonitored for long periods. If you don’t have the resources, time or inclination to constantly monitor and manage your positions, leveraged and inverse ETFs are not for you.
*Definitions & Index Descriptions | Direxion
For more news, information, and analysis, visit the Leveraged & Inverse Channel.
The ICE U.S. Treasury 7-10 Year Bond Index (IDCOT7TR) is a market value weighted index that includes publicly issued U.S. Treasury securities that have a remaining maturity of greater than seven years and less than or equal to ten years. Eligible securities must be fixed rate, denominated in U.S. dollars, and have $300 million or more of outstanding face value, excluding amounts held by the Federal Reserve. Securities excluded from the Index are inflation-linked securities, Treasury bills, cash management bills, any government agency debt issued with or without a government guarantee and zero-coupon issues that have been stripped from coupon-paying bonds.
The ICE U.S. Treasury 20+ Year Bond Index (IDCOT20TR) is a market value weighted index that includes publicly issued U.S. Treasury securities that have a remaining maturity of greater than 20 years. Eligible securities must be fixed rate, denominated in U.S. dollars, and have $300 million or more of outstanding face value, excluding amounts held by the Federal Reserve. Securities excluded from the Index are inflation-linked securities, Treasury bills, cash management bills, any government agency debt issued with or without a government guarantee and zero-coupon issues that have been stripped from coupon-paying bonds.
An investor should carefully consider a Fund’s investment objective, risks, charges, and expenses before investing. A Fund’s prospectus and summary prospectus contain this and other information about the Direxion Shares. To obtain a Fund’s prospectus and summary prospectus call 866-476-7523 or visit our website at www.direxion.com. A Fund’s prospectus and summary prospectus should be read carefully before investing.
Leveraged and Inverse ETFs pursue daily leveraged investment objectives which means they are riskier than alternatives which do not use leverage. They seek daily goals and should not be expected to track the underlying index over periods longer than one day. They are not suitable for all investors and should be utilized only by sophisticated investors who understand leverage risk and who actively manage their investments.
Neither Rafferty nor the Direxion Daily 7-10 Year Treasury Bull 3X Shares, Direxion Daily 7-10 Year Treasury Bear 3X Shares, Direxion Daily 20+ Year Treasury Bull 3X Shares and the Direxion Daily 20+ Treasury Bear 3X Shares (the “Financial Products”) is sponsored, endorsed, sold or promoted by Interactive Data Pricing and Reference Data, LLC or its affiliates (“Vendor”). Vendor makes no representation or warranty regarding the advisability of investing in securities generally, in the Financial Products particularly, or the ability of the ICE U.S. Treasury 7-10 Year Bond Index or ICE U.S. Treasury 20+ Year Bond Index to track general financial market performance. VENDOR MAKES NO EXPRESS OR IMPLIED WARRANTIES, AND HEREBY EXPRESSLY DISCLAIMS ALL WARRANTIES OF MERCHANTABILITY OR FITNESS FOR A PARTICULAR PURPOSE WITH RESPECT TO THE ICE INDEX OR ANY DATA INCLUDED THEREIN. IN NO EVENT SHALL VENDOR HAVE ANY LIABILITY FOR ANY SPECIAL, PUNITIVE, INDIRECT, OR CONSEQUENTIAL DAMAGES (INCLUDING LOST PROFITS), EVEN IF NOTIFIED OF THE POSSIBILITY OF SUCH DAMAGES.
Direxion Shares Risks — An investment in each Fund involves risk, including the possible loss of principal. Each Fund is non-diversified and includes risks associated with the Funds’ concentrating their investments in a particular industry, sector, or geographic region which can result in increased volatility. The use of derivatives such as futures contracts and swaps are subject to market risks that may cause their price to fluctuate over time. Risks of each Fund include Effects of Compounding and Market Volatility Risk, Leverage Risk, Market Risk, Rebalancing Risk, Aggressive Investment Techniques Risk, Counterparty Risk, Intra-Day Investment Risk, Other Investment Companies (including ETFs) Risk, Cash Transaction Risk, Tax Risk, and risks specific to U.S. Government Securities. Additional risks include, for the Direxion Daily 7-10 Year Treasury Bull 3X Shares, Daily Index Correlation Risk, and for the Direxion Daily 7-10 Year Treasury Bear 3X Shares, Daily Inverse Index Correlation Risk, and risks related to Shorting. A security backed by the U.S. Treasury or the full faith and credit of the United States is guaranteed only as to the timely payment of interest and principal when held to maturity. The market prices for such securities are not guaranteed and will fluctuate. Please see the summary and full prospectuses for a more complete description of these and other risks of each Fund.
Distributor: Foreside Fund Services, LLC.
