
Overview
- Risk and uncertainty remain in the near-term, but improving economic data helps support the risk rally. We are cautiously optimistic in our outlook on the equity markets, and are becoming increasingly confident that investors can selectively look towards exposures in more cyclical segments of the stock market. We also believe, however, that portfolios may be best served striking a balance with protection (defensive, quality, low correlation, etc.) along with participation.
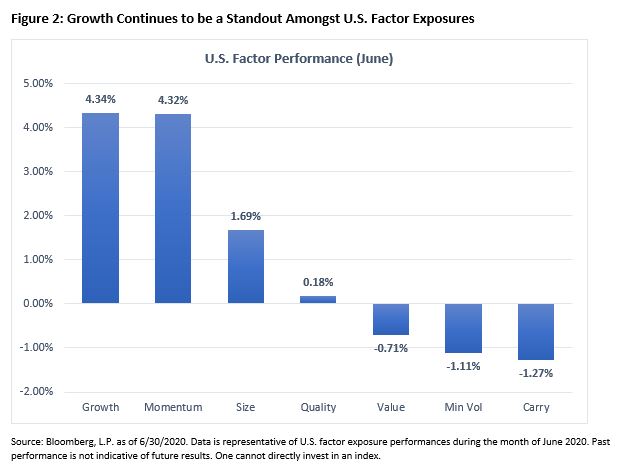
- June provided one of the single best months for growth performance relative to value since the Great Financial Crisis, and the spread between two closely followed equity styles is one of many performance spreads we continue to watch throughout 2020. Divergences remains a key theme for investors to pay attention to.
- 2Q earnings season and the upcoming U.S. elections will add to the uncertainty on the road to recovery.
The Road to Recovery
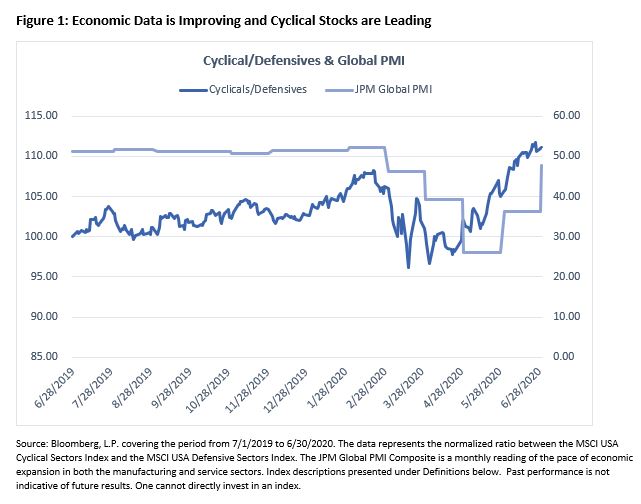
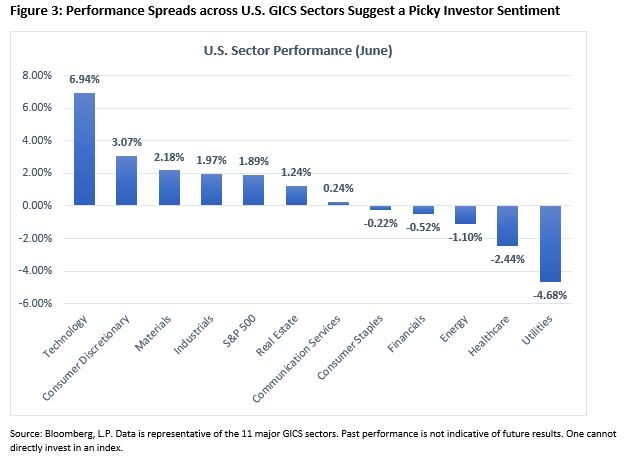
Global risk assets have continued to reward investors who have stayed the course, and while performance was a bit mixed in June, resiliency remained largely intact as we saw improvements in the economic picture throughout the month. While the most-watched global equity and credit benchmarks work back towards all-time highs, we want to continue to remind investors of the underlying divergences and spreads across sectors, industries, sizes, factors, and geographies. In the last month, the Nasdaq-100 outperformed the S&P 500 by 4.38%, which would mark June 2020 as the largest relative one-month gain between the pair over the last ten years if not for March 2020. Year-to-date, the spread between the two U.S. Large Cap benchmarks sits just shy of 20%. Across the eleven standard GICS sectors, the best performing sector, Information Technology (+ 6.94%), outpaced the worst performing, Utilities (- 4.68%), by over 11%, further highlighting the nature of the rally in global equity markets since March. While the U.S. dollar weakened significantly out of May and throughout June (which may prove to be pro-cyclical), the behavior of traditional safe havens, such as gold, does suggest that investors are still cautiously optimistic about the current regime, and the near term.
While the road to recovery, in both the markets and in the economy, is showing further signs of clarity, our base case continues to be that risks and uncertainty remain. Potentially driven by sporadic increases in virus cases here in the United States, Q3 is likely to show somewhat slower growth and recovery. Almost 70% of the S&P 500, by weight, reports earnings in the last two weeks of July and during the first week of August, and while the market already seems to be looking into 2021, estimates remain as uncertain as they did last quarter, especially as the number of companies halting fiscal year guidance continue to rise. Many analysts anticipate this 2Q earnings season to be one of the worst on record, but “net beats” may provide further optimism that the environment is better than expected. All that being said, however, we are beginning to feel more confident that investors can, while being selective, lean some exposures towards more cyclical segments of the equity market, but also suggest finding an appropriate balance of protection with participation.
Performance was Mixed, Divergences have been Persistent
Whether investors are looking at the market cap spectrum, the factor spectrum, different sectors and industries, or different geographies, the theme of divergences continued throughout June. We noted the historic one-month performance spread between the Nasdaq-100 and the S&P 500 in June, but Large Caps actually lagged Small Caps by 1.32% in June, as measured by the Russell 1000 and Russell 2000 benchmarks, respectively. While the Russell 2000 did not outperform the Nasdaq-100 in June, small caps have been showing signs of life relative to large caps over the last three months, which is supportive of some further pro-cyclical positioning.
The growth vs. value trade continues to trend one way, and while valuations continue to look more and more attractive for value, the market maintains a premium on those companies that are able to materially grow top and bottom lines. Year-to-date, growth has bested value to the tune of 26.07%, the largest 6-month spread (by far) since the GFC. Like we saw for the Nasdaq-100 relative to the S&P 500, the month of June was the single best month (with exception to March 2020) of relative performance for growth vs. value in over 10 years, where growth outperformed by 5.06%.
Clearly, divergences and spreads stretch well beyond U.S. sectors and industries. In June, cyclical sectors outperformed defensive sectors by 5.77% as Technology and Consumer Discretionary stocks were market leaders once again. Over the past three months, cyclical outperformance (+ 12.25%) sits just 1.29% behind growth vs. value as the largest performance spread among the pairs we follow. From an earnings perspective, we anticipate that the Technology sector and underlying industries such as internet, software, and semiconductors will provide the most upside risk for investors. While forward guidance will be key here, the overweight in technology within the cyclicals basket gives us some confidence that this trend can continue.
For many investors, international equity exposure has played a smaller role in portfolios in 2020. Whether this has been driven by tactical allocation decisions, or a natural byproduct of relative performance, we would urge investors to pay attention to international developed and emerging equities, especially if pro-cyclical positioning is something one hopes to achieve. Led by standout performance in A and H-share Chinese equities, international stocks bested U.S. stocks in the month of June by 2.26%, and emerging markets gained 7.51%, outperforming their developed counterparts by 4.40%. We are continuing to watch the path of the U.S. dollar for its ties to international, especially EM, performance.
Money in Motion
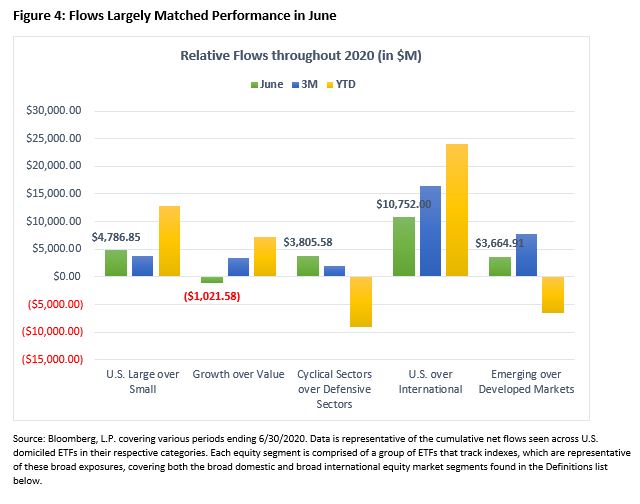
Relative flows were in-line with relative performance results throughout the five major pairs in June. While the pace of flows into broad growth exposures lagged, they were far from negative. Broad-based growth ETFs attracted $313mm in net creations throughout June, but value (+ $1,334mm) investors continued to systematically allocate to value stocks. Cyclical sector flows continue to be allocated into distinct segments of the U.S. marketplace, specifically Technology and Communication Services. In June, however, Industrials (+ $1,304mm) and Real Estate (+ $693mm) ETFs were leaders along with Technology-focused products (+ $717mm).
Small Caps continue to lag relative to Large Caps when it comes to net creation activity, and as we do not anticipate sustained leadership from small cap stocks from a performance perspective, we do not anticipate a shift in flows behavior. As it pertains to our slight, but meaningful, pro-cyclical bias, it was encouraging to see broad investor support for emerging market stocks continue in June.
Where are we Heading?
As we approach the U.S. presidential elections in November, it seems that markets feel comfortable with the outcome of a Democratic sweep that is currently reflected as a slight consensus. Under the hood, however, risks (and opportunities) remain across different sectors and industries, especially those with higher sensitivity to an increase in corporate taxes or within Healthcare. Either way, uncertainty will persist around the election process and increased volatility will surely be a result.
As 2Q earnings season kicks off, we will be overly focused on commentary and dialogue from management, and their thoughts on navigating the current and near-term regime. The consensus seems to be that S&P 500 EPS will fall ~ 44% year-over-year when all is said and done in 2Q, but positive rhetoric can help support risk assets going forward. As spreads and divergences continue to be a theme, investors should pay attention to the disparity in top-line and bottom-line results for companies in different sectors, and market cap and style designations.
Risks remain on the road to recovery and the rest of 2020, and uncertainty will continue to be a theme across markets. The backdrop of supportive fiscal and monetary policy has been, and should continue to be, good for risk assets, and there continues to be positive developments regarding COVID-19 around the world. Investors may be best served, however, maintaining a strong balance of participation and protection. As we have seen in months prior, this recovery is proving to be unlike others past, and the playbook going forward will likely evolve as winners and losers continue to emerge.
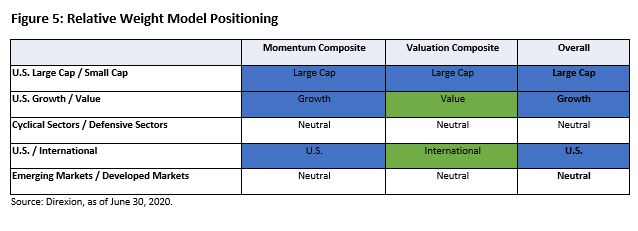
Current Positioning
Figure 5 highlights the current positioning of our quantitatively based Relative Weight Model. These views are recalibrated monthly based on composite measures of momentum and valuation. Compared to last month, our model remains overweight to Large Cap, Growth, and the U.S. The recent performance in cyclical sectors has pushed the momentum composite score to favor cyclicals, but the overall macro environment leaves us with a slight defensive lean, especially given our overall portfolio construction. Both the momentum and valuation composites are moving in favor of Emerging Markets, so we are continuing to watch how this space develops in the near-term to make a potential allocation change.
Definitions
Russell 1000: The Russell 1000® Index consists of the largest 1,000 companies in the Russell 3000 Index, which is made up of 3,000 of the largest U.S. companies.
Russell 2000: The Russell 2000® Index is comprised of the smallest 2000 companies in the Russell 3000 Index, representing approximately 8% of the Russell 3000 total market capitalization.
Russell 1000 Growth: The Russell 1000® Growth Index measures the performance of those Russell 1000 companies with higher price-to-book ratios and higher forecasted growth values.
Russell 1000 Value: The Russell 1000® Value Index measures the performance of those Russell 1000 companies with lower price-to-book ratios and lower forecasted growth values.
MSCI USA Cyclical Sectors: The MSCI USA Cyclical Sectors Index is based on MSCI USA Index, its parent index and captures large and mid-cap segments of the US market. The index is designed to reflect the performance of the opportunity set of global cyclical companies across various GICS® sectors. All constituent securities from Consumer Discretionary, Financials, Industrials, Information Technology and Materials are included in the Index.
MSCI USA Defensive Sectors: The MSCI USA Defensive Sectors Index is based on MSCI USA Index, its parent index and captures large and mid-cap segments of the US market. The index is designed to reflect the performance of the opportunity set of global defensive companies across various GICS® sectors. All constituent securities from Consumer Staples, Energy, Healthcare, Telecommunication Services and Utilities are included in the Index.
FTSE All-World ex US: The FTSE All-World Excluding United States Index is a free float market capitalization weighted index. FTSE All-World Indices include constituents of the Large and Mid-capitalization universe for Developed and Emerging Market segments.
MSCI EAFE IMI: The MSCI EAFE Investable Market Index (IMI), is an equity index which captures large, mid and small cap representation across Developed Markets countries around the world, excluding the US and Canada.
MSCI Emerging Markets IMI: The MSCI Emerging Markets Investable Market Index (IMI) captures large, mid and small cap representation across 24 Emerging Markets (EM) countries.
MSCI EAFE IMI: The MSCI EAFE Index, is an equity index which captures large and mid cap representation across Developed Markets countries around the world, excluding the US and Canada.
MSCI Emerging Markets IMI: The MSCI Emerging Markets Index captures large and mid cap representation across 24 Emerging Markets (EM) countries.
An investor should carefully consider a Fund’s investment objective, risks, charges, and expenses before investing. A Fund’s prospectus and summary prospectus contain this and other information about the Direxion Shares. To obtain a Fund’s prospectus and summary prospectus call 866-301-9214 or visit our website at direxioninvestments.com. A Fund’s prospectus and summary prospectus should be read carefully before investing.
Market Disruptions Resulting from COVID-19. The outbreak of COVID-19 has negatively affected the worldwide economy, individual countries, individual companies and the market in general. The future impact of COVID-19 is currently unknown, and it may exacerbate other risks that apply to the Funds.
Shares of the Direxion Shares are bought and sold at market price (not NAV) and are not individually redeemed from a Fund. Market Price returns are based upon the midpoint of the bid/ask spread at 4:00 pm EST (when NAV is normally calculated) and do not represent the returns you would receive if you traded shares at other times. Brokerage commissions will reduce returns. Fund returns assume that dividends and capital gains distributions have been reinvested in the Fund at NAV. Some performance results reflect expense reimbursements or recoupments and fee waivers in effect during certain periods shown. Absent these reimbursements or recoupments and fee waivers, results would have been less favorable.
Direxion Relative Weight ETFs Risks – Investing involves risk including possible loss of principal. The ETFs’ investments in derivatives may pose risks in addition to, and greater than, those associated with directly investing in or shorting securities or other investments. There is no guarantee that the returns on an ETF’s long or short positions will produce high, or even positive returns and the ETF could lose money if either or both of the ETF’s long and short positions produce negative returns. Please see the summary and full prospectuses for a more complete description of these and other risks of the ETFs.
Distributor: Foreside Fund Services, LLC
