
 U.S. loses 33,000 jobs in September, the first decline in seven years
By Hafeez Esmail, Main Management
According to the government’s Bureau of Labor Statistics (BLS) data, the economy ‘shed’ 33,000 jobs in September. This is the first decline since 2010 as the nation was clawing back from the Financial Crisis of 2008-09. Expectations had been for a rise of 80-90,000 jobs so the actual number missed by a wide mark. The loss of jobs in the BLS data differed from the Automatic Data Processing (ADP) jobs number which indicated 134,000 jobs were added.
How is it possible for these job measures to have such different readings? The ADP report records the number of people that are on private employer payrolls. In contrast, the BLS records the number of people who actually received a paycheck. As a result, it’s conceivable that fewer paychecks were distributed to individuals in disaster areas (with many businesses shut down for extended periods) although they may not have been permanently removed from payrolls. If so, Hurricanes Harvey, Irma and Maria may have weighed heavily on the difference between the numbers.
To examine whether the loss of jobs (as measured by the BLS) is likely to be a prolonged drag on the economy, it may be useful to determine how different industries fared in the latest report. Relative to the average of the past 12 months, Transportation and Warehousing showed the strongest increase. Most other segments trailed their trailing 12 month average levels, with Leisure and Hospitality showing the most dramatic decline.
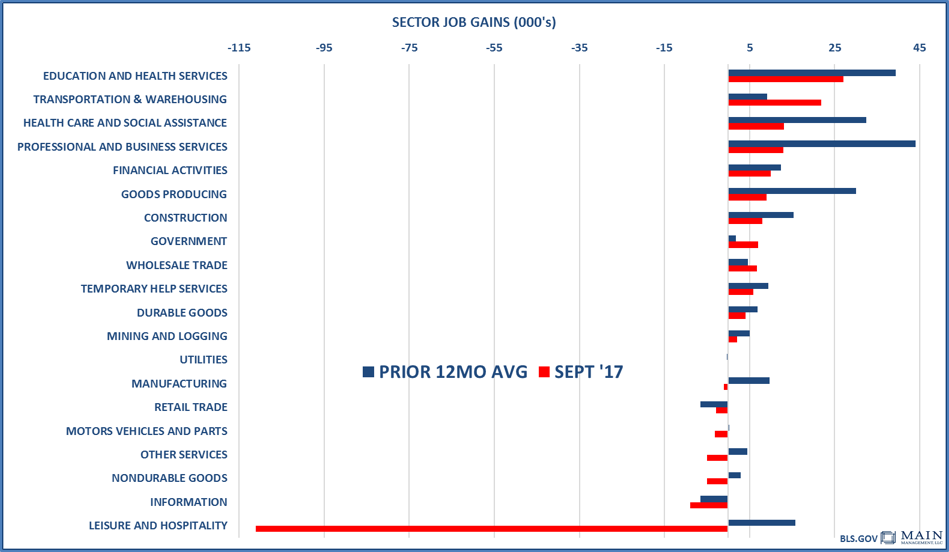
A fall in Leisure and Hospitality jobs, particularly in areas known for tourism (such as multiple locations in Florida and Texas) seems consistent with the disaster conditions that prevailed in September. Moreover, with many people losing homes and vehicles from hurricane related conditions, it may make sense for Transport and Warehousing jobs to see a notable uptick. However, once the extreme conditions subside, is it illogical to assume that a more ‘normalized’ job pattern would return?
To test if the job losses may be temporary, it’s worth examining the unemployment patterns around similar disasters in past years. Below is a chart of the weekly unemployment claims starting 4 weeks before severe, damaging storms and ending 8 weeks after Hurricane Katrina and Superstorm Sandy. After 8 weeks following these extreme weather conditions, Unemployment Claims are similar to the 4 week level before the disasters struck.
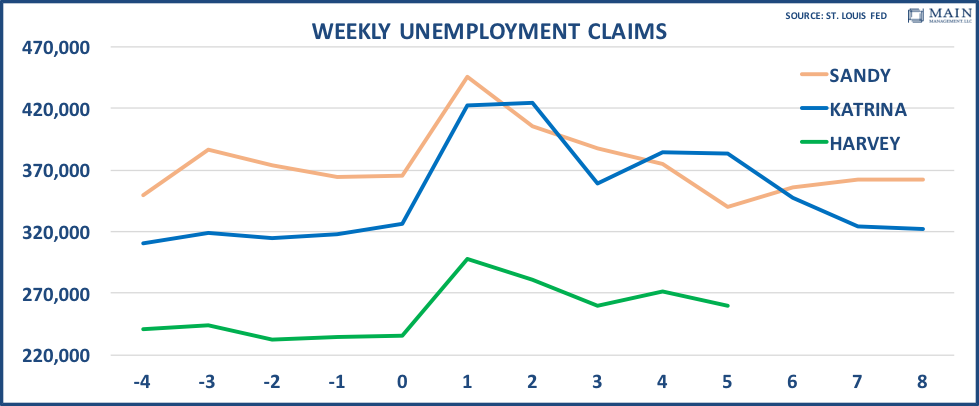
WEEKS BEFORE AND AFTER STORM IMPACT (0 = WEEK OF STORM IMPACT)
Within the first week after disaster strikes (Week 0 to Week 1) Weekly Unemployment Claims increased by an average of 26%. Hurricane Harvey was in line with the average, with Claims rising 26.3%. From Week 1 to Week 5 Unemployment Claims fell by -15.3% on average. Thus far, for the same time frame following Harvey, they have fallen -12.8% thus exhibiting a similar trajectory.
