
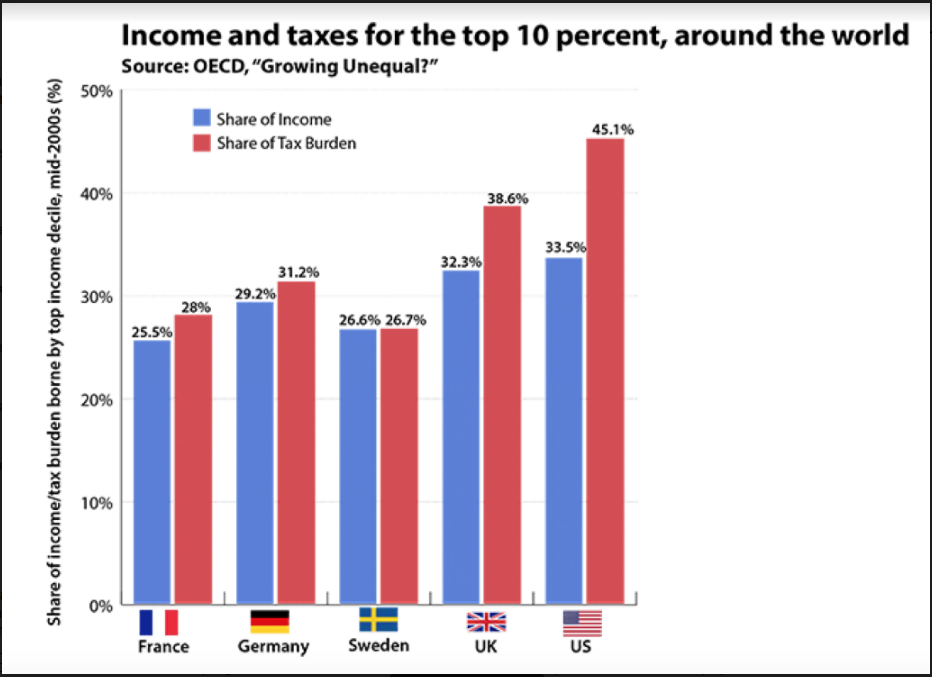
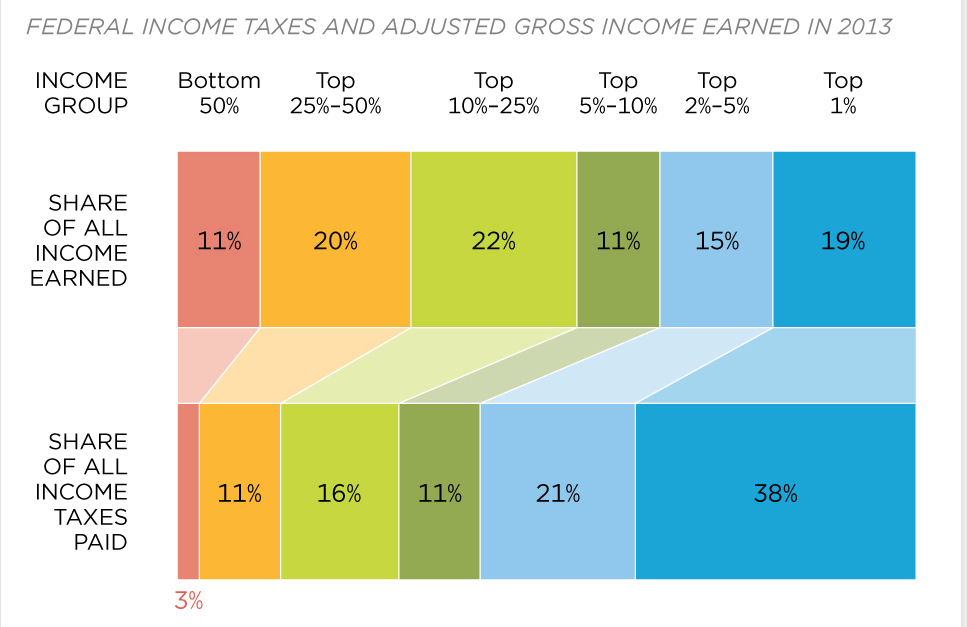
The reason our tax code is so much more progressive than other countries is because the rich of the United States pay more overall taxes as a percent of the total taxes received than the rich of other countries. In the US, the top 1% earn 19% of all adjusted gross income in the country, yet pay 38% of all federal taxes. Meanwhile, the bottom 50% of income earners in our country pay virtually no income tax at all (3%) so our country’s taxes are much more skewed to the rich than other countries.
By contrast, other countries tax their richest citizens at similar rates or even slightly higher rates than the United States, but the big difference between the US and places like Europe is that ordinary people pay much higher taxes in Europe.
That brings up the perennial question … how much is “fair”? How progressive should our country’s taxes be? The top 20% of all earners pay 88% of all income taxes paid in our country. Is it “fair” to go even higher? How about all the way to 100%? Is that where we are heading? Or should there be some modest taxes levied against all American workers?
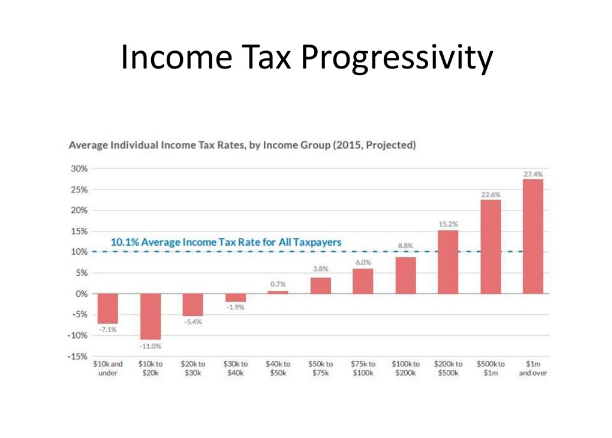
Many believe that Europe is the model that should be emulated. What is not widely known, however, is that Europe’s taxes approximate the percentage that the cohort earns, i.e. the top quintile pays 20% of total taxes and on down for each quintile. That said, the “headline” tax rates look progressive in Europe, but they should be viewed in the context of the overall picture. For instance, in Germany, the posted income tax rates range from zero on incomes below $10,500 up to a 45% rate on the highest income earners which, on its face, appears quite progressive. But, as the Wall Street Journal points out (see here), “if you look at the proportion of gross household income paid in all forms of tax, the rate varies by only 25 points. The lowest earning 5% of households pay roughly 27% of their income in various taxes – mainly VAT – while a household in the 85th income percentile may pay total taxes of around 52%, mostly in social security taxes that amount to nearly double the income tax bill.” That means the real difference between the taxes paid by the rich and poor is only a 25% difference as opposed to the 45% spread in the posted rate. The majority of “collected” taxes stem from VAT and social taxes. The consequence of country’s dependency on VAT is that the poor are penalized the most as they spend a higher proportion of their income and because the social taxes tend to kick in at lower income levels than income taxes, and extract a higher and more uniform proportion of income.
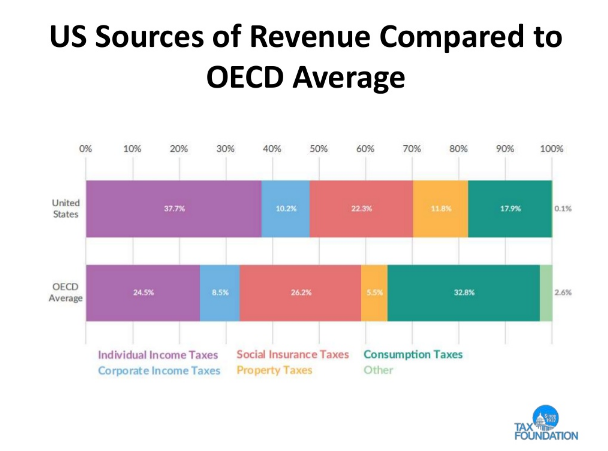
Few in the United States would favor such a system since so many pay no taxes at all and would become taxpayers for the first time. The contrast between the US and the OECD countries is stark. The chart below shows the dependency on VAT and social insurance taxes in the OECD countries at 59%, which is 45% higher than the 40.6% level for those two sources in the United States. The individual taxes are the highest source of federal government revenues in the United States at 37.7% of the total and the vast majority (88%) of those funds are paid by only 20% of the population. That contrasts with 24.5% for the OECD countries.
Where do we go from here?
All the above suggests to us that while there might appear to be some room for more or different forms of taxes, we are reaching a point where revenues are close to maximum levels relative to GDP. First and foremost, a faster pace of economic growth than what prevailed over the past 10+ years would help in revenue generation. Prior to the past 11 years of sub-3% growth, our country has never had a period longer than 4 years where there was no 3% GDP expansion. Additionally, a thoughtful tax cut could both help to both accelerate GDP trends, but also positively impact the amount of collected tax revenues. Our 4/18/17 memo entitled “Thoughts on Taxes” examined in great detail the positive results of three countries which lowered tax rates – England, Canada, and Ireland, as well as the positive results of the Reagan tax cuts (for a copy of this report, contact Main Management).
Turning to the outlay side of the equation, Congress has recently focused on infrastructure and regulations … and they should. We look at both as expense bottlenecks and heavy burdens to our nation’s future economic well-being. 72% of budget outlays and 15% of GDP are currently in what the Office of Management and Budget labels as “human resources” (Social Security, Medicare, Education, Training, and Social Services, etc.). Those areas have grown at a compound growth rate of 4.6% over the past five years, which is 3.5 times the current 1.3% rate of inflation. While the OMB predicts that the next 5 years will expand by “only” 3.5%, it still means that the 72% portion of total budget outlays is on a pace to double in 20 years. That will come at a time when there is an effort to rebuild the military and when net interest costs will be rising rapidly. It is therefore imperative that expenses be controlled where they can.
The government has the capability to save significant amounts of money … the question is always the will to do so. Since 1993,The Competitive Enterprise Institute (CEI) has generated an annual report entitled “Ten Thousand Commandments” (see here) which delves into the cost of regulation in our country as they believe that “reducing overspending and relieving regulatory burdens are vital to the nation’s health”. Their document analyzes the “hidden taxes” stemming from America’s regulatory state and puts a number on those bloated costs within our government. Their overall estimate, based on federal government data, is that the burden of regulatory costs to our country totals $1.963 Trillion.
Some perspective on that figure follows:
• The size of the estimated regulatory cost would equivalent to the world’s seventh-largest economy … just behind India and ahead of Italy
• Were the cost of federal regulation to flow all the way down to households, US households would ‘pay’ $14,809 annually from the regulatory hidden taxes
• The cost of the regulatory compliance exceeds the $1.82 Trillion collected by the IRS in individual and corporate taxes; would equate to over 50% of the 2016 budget outlays; represents about 10.5% of our nation’s GDP; and rivals corporate profits of approximately $2.14 Trillion.
• The regulatory costs obviously come from regulations. The Federal Register finished 2016 with 95,894 pages, a new record. During 2016, Congress passed 214 laws while Agencies issued 3,853 rules, so there were 18 rules issued for every law passed thereby delegating powers to unelected agency officials. There were also 3,318 regulations in the pipeline, of which 193 were deemed ‘significant’ meaning it would potentially have more than a $100 million impact on the economy.
• The Mercatus Center at George Mason University estimated that “if regulatory burdens had remained constant since 1980, the 2012 economy would have been 25% larger or, put another way, the economy grew by at least $4 trillion less each year than it could have”.
The point in all of this is that there are tremendous amounts of expense savings that can be achieved because the base is so large. Everyone has examples of areas where the government could do a better job. A few quick examples that we feel are illustrative are:
• Entire agencies could be looked at and streamlining of efforts should be on the table everywhere. For instance, the original intent when the Department of Energy was established to reduce our dependency on foreign oil. Now that we are ‘effectively’ energy independent because of fracking, do we really need to spend $32.5 Billion there?
• An industry example of where governmental regulatory red-tape abounds in housing. Per the National Association of Home Builders, on an overall basis, the regulatory cost as a share of a new single-family home price is 24.3% (range 14.0 to 30.3%) or $84,671, of which 60% can be attributed to regulations impacting the price for a finished lot, including its development, while the other 40% would be attributable to the cost of construction after the purchase of the lot (see here). On average, they say, the regulatory process typically adds 6.6 months to the development process (ranging from no time to as long as 5 years)
• From an income disbursement basis, the United States annually makes improper payments that aggregate in the billions (see here). For the fiscal year 2016, improper payments totaled $144 billion, up from $137 billion the previous year.
The overall error rate was 5.1%, up from 4.0% as recently as four years ago. While that may seem like a “small number on a large number” story, it is disconcerting to note that the Department of Veterans Affairs (VA) had an extraordinarily high 75.9% error rate in their Community Care effort. It is also noteworthy that the US Treasury had a 24% improper payment error rate in disbursing Earned Income Tax Credits. Approximately 75% of the errors are made through overpayments which means the burden of proof is on the Government to claw back those funds. Could a private sector collection agency do a better job for a small incentive fee? We think so.
The cumulative improper payments now total $1.4 Trillion since 2003.
• Internal accounting capability seems that it could be suspect area as well. In a March 1, 2017 Inspector General’s report (which can be found here), the IG found that “the total amounts of errors corrected in HUD’s notes and consolidated statements were $516.4 billion and $3.4 billion, respectively” (emphasis is ours).
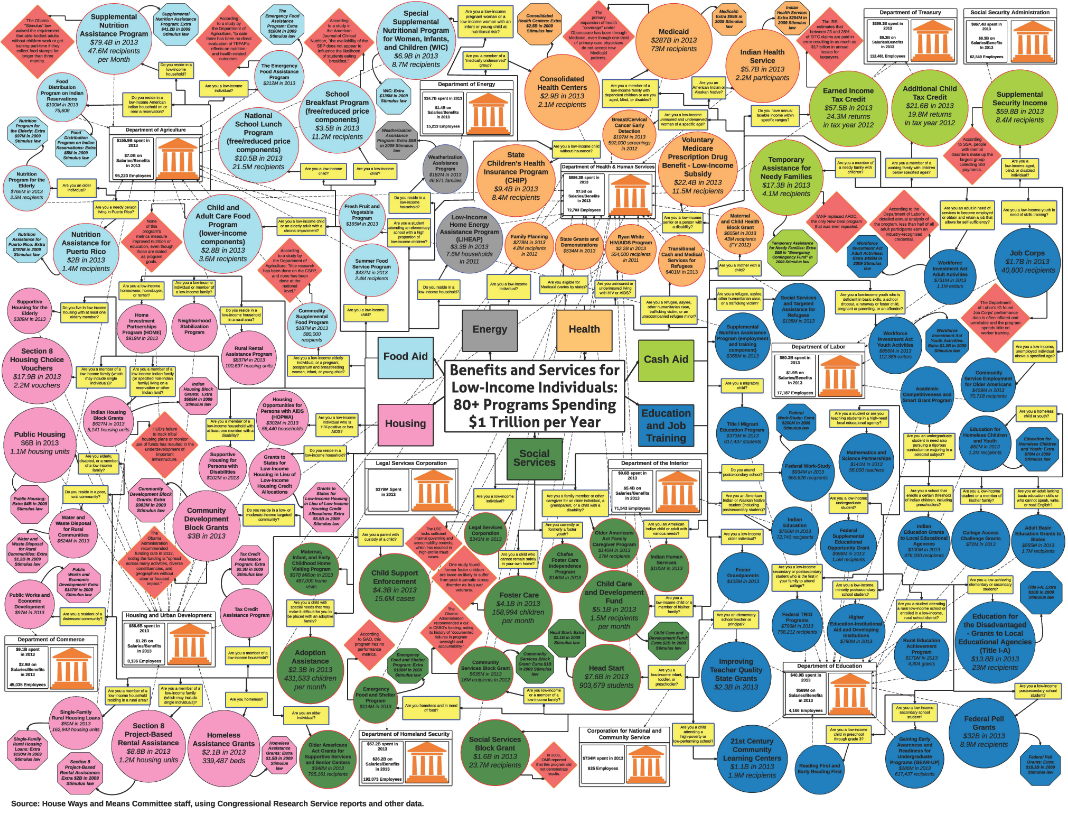
While the errors identified may not have changed HUD’s financial position, it is unbelievable that the department downplayed the errors by saying that “The accompanying notes are integral to these statements.” Of course they are, but shockingly the footnotes contained errors of $516.4 billion. One can only wonder how many entries the bookkeepers at HUD got right, or whether they had any time left in the day to put in an accurate entry! Everyone has their own examples of bureaucratic inefficiencies within the government. As a last example, we believe a picture is worth 1,000 words. Consider the schematic below which shows how the 80+ programs which allocate $1 Trillion in annual welfare payments are managed (?). It cries out for reorganization!
We don’t demand perfection … but is it too much to expect the federal government to represent its taxpayers with a modicum of competence! We can do better!
J. Richard Fredericks is founding partner at Main Management, a participant in the ETF Strategist Channel.
Disclosure Information
A pioneer in managing all-ETF portfolios, Main Management LLC is committed to delivering liquid, transparent and cost-effective investment solutions. By combining asset allocation insights with smart implementation vehicles, Main Management offers a unique approach that translates into distinct advantages for our clients, including diversification, cost efficiency, tax awareness and transparency. http://www.mainmgt.com
