Last week, several key economic data points were released that provide insight into the overall health of the U.S. economy. In this week’s article, we have highlighted the important data points from the February jobs report, the January JOLTS summary, and the January trade balance report. These indicators are closely watched by policymakers and advisors trying to understand the direction of interest rates because the data can have a significant impact on financial markets and business decisions.
February Jobs Report
The February employment report revealed stronger-than-expected job growth on Friday, showing 311,000 jobs added for the month of February, exceeding expectations (the Investing.com forecast was 205,000) and indicating continued strength in the labor market. However, other data points in the report signaled a slowdown. The unemployment rate rose for the first time in five months to 3.6%, and the labor force participation rate increased for a third consecutive month to 62.5%, its highest level since the 2020 recession. Additionally, decreases in weekly wages and hours worked were reported that could reflect slower economic growth. Overall, the jobs report was mixed but better than what most had feared.

Read more about the latest employment report by clicking here.
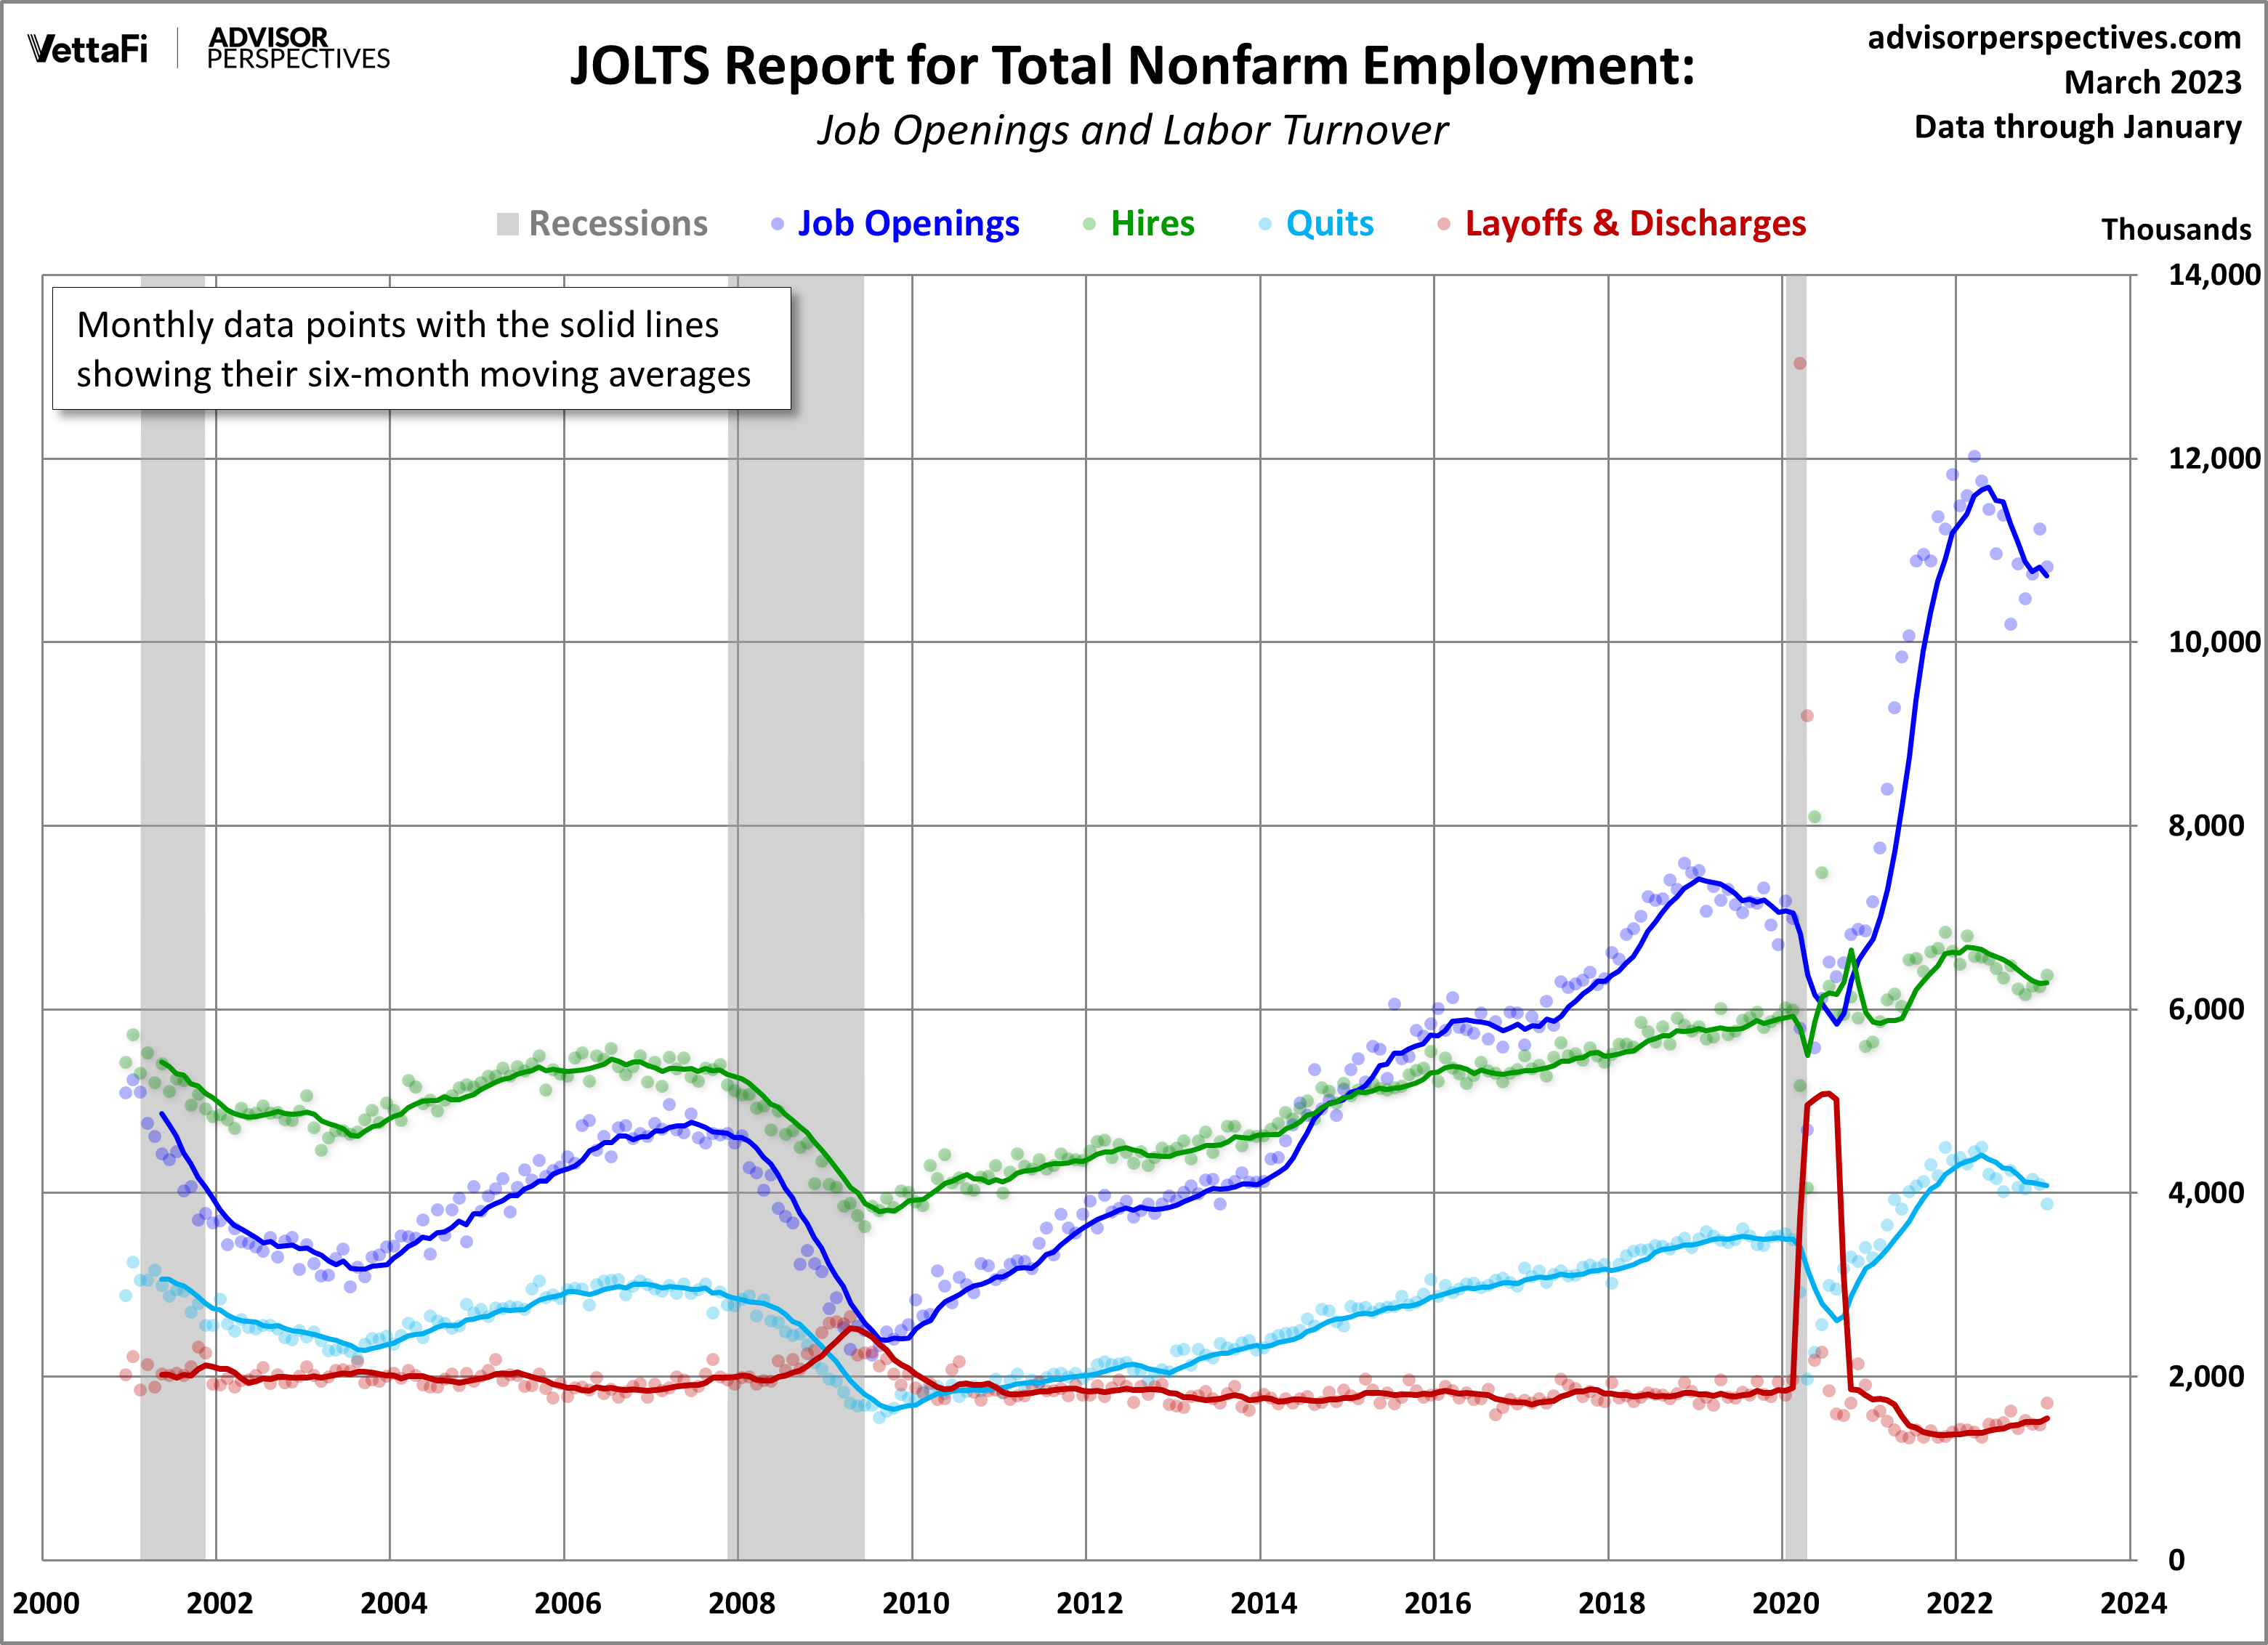
January JOLTS (Job Openings Labor Turnover)
The January JOLTS summary was highlighted by a decrease of 410,000 job openings from December to 10.8 million, with the largest decline coming in the construction sector. Other key data points in the summary showed that hiring increased slightly to 6.4 million, layoffs surged by over 240,000, and quits fell by about 200,000. The JOLTS data helps gauge labor demand, and while January’s report indicates a cooling labor market, there are still 1.9 job openings for every available worker.
Read more about the latest JOLTS summary by clicking here.
January Trade Balance
The U.S. international trade deficit expanded by 1.6% in January to $68.3 billion from a revised December figure of $67.2 billion. Both imports and exports grew, with the goods deficit decreasing by $0.6 billion, and the services surplus decreasing by $1.7 billion. Compared to last year, the trade deficit was down 22%. January’s reading showed the largest monthly gap between imports and exports that we have seen in the last three months. However, due to the extreme volatility of this monthly indicator, it’s best to look at the six-month moving average for a clearer picture of the overall trend. The six-month moving average dropped for an eighth consecutive month to $68.4 billion, its lowest figure since July 2021.

This week, keep an eye out for Tuesday’s release of the Consumer Price Index (CPI), Wednesday’s release of the Producer Price Index (PPI), and the latest data on retail sales. Such data will reveal more insight into whether U.S. inflation continues to cool and whether consumer spending has persisted. The year-over-year headline and core CPI are expected to come in lower than last month at 6.0% and 5.5%, respectively. The month-over-month headline and core PPI are expected to come in lower than last month at 0.3% and 0.4%, respectively. Retail sales will impact interest in the SPDR S&P Retail ETF (XRT) and are expected to be down 0.3% from last month.
Read more about the latest trade balance report by clicking here.
For more news, information, and analysis, visit VettaFi | ETF Trends.
