Gold fell for the sixth straight month in September, a losing streak we haven’t seen since 2018, as the Federal Reserve undertakes its most aggressive rate hike cycle in recent memory. The central bank has added close to 250 basis points (bps) so far this year in its fight against inflation, and many asset classes, from stocks to bonds to Bitcoin, have the bruises to show for it.
Gold is no exception, though it’s managed to hold up better than most investments, despite higher rates and an historically strong dollar, the precious metal’s longtime adversary. As of Friday, the S&P 500 has lost 22% for the year, while gold is down only 7%.
If you didn’t already know that September has often been the worst month for stocks, you probably know it now. This past September did not disappoint. The S&P 500 gave back more than 9%, marking the worst month since March 2020 and worst September since 2008.
Emerging markets tanked as well during the month, with index heavyweights Taiwan Semiconductor, Tencent, Samsung Electronics and Alibaba all falling between 15%4 and 20%.
Once again, gold and other precious metals were a bright spot. Although the metal cooled by nearly 3%, it was enough to beat U.S. Treasury and corporate bonds, domestic and oversea stocks, commodities and Bitcoin. In the bloodbath that was September, gold’s traditional role as a diversifier and haven was clear to see.
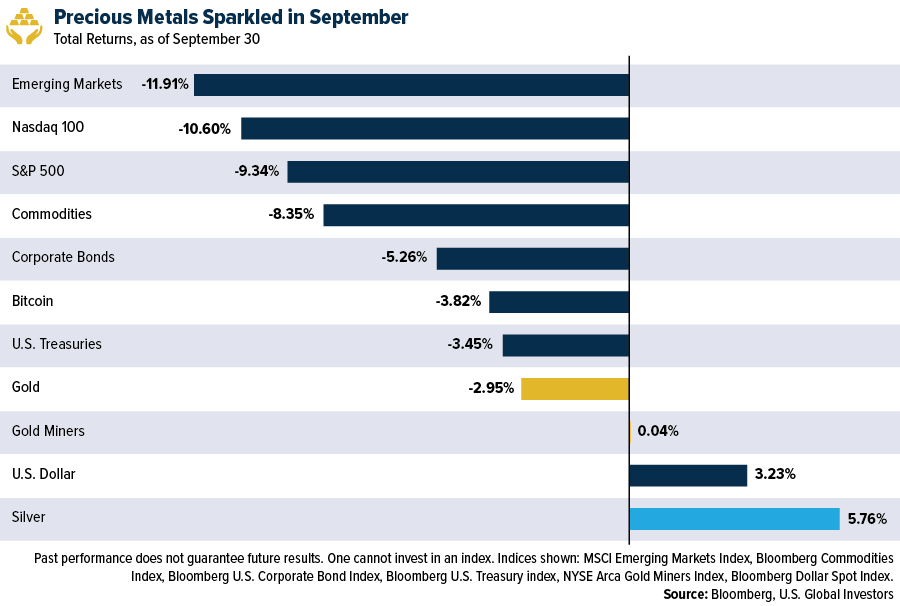
Silver turned in an even better showing, rising 5.7% on anticipated growth in industrial demand. The white metal is used in solar panels, the production and installation of which are set to increase dramatically following August’s passage of the Inflation Reduction Act, the largest-ever federal investment in renewable energy. The two best performing S&P 500 stocks in the third quarter were wind and solar companies Enphase Energy (+50%) and Constellation Energy (+45%).
Gold Miners Break Out Of Downward Trend
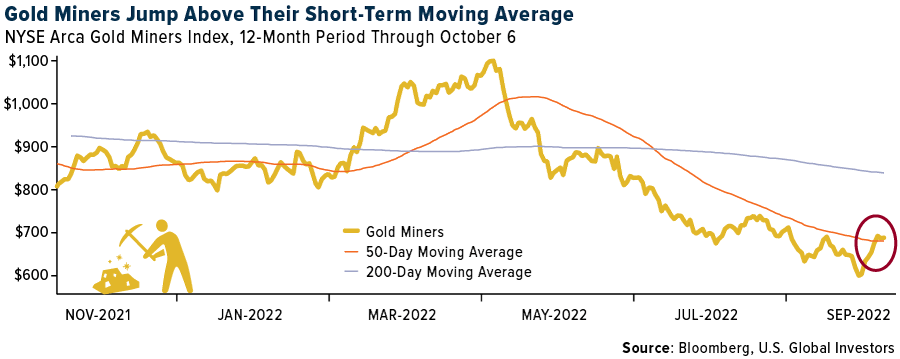
Meanwhile, gold and silver miners, as tracked by the senior NYSE Arca Gold Miners Index, were essentially flat for the month, breaking a five-month losing streak. The industry has had a challenging year. Down 21% year-to-date, mining stocks are on track for their worst year since 2015, when they fell 25.5%.
But the worst may be behind them. Since hitting a 52-week low on September 26, mining stocks have risen about 18% and today notched their second straight week of positive gains.
Looking ahead, the group appears to be teeing up for further growth. Having broken out of a downward trend going back to April, the index crossed above its 50-day moving average last week, which I see as a bullish signal.
Retail Investors Prefer Physical Gold Coins To ETFs
In getting exposure to gold, U.S. retail investors seem to favor physical bullion over ETFs. Gold-backed ETFs around the world experienced widespread outflows in September, the fifth straight month of drawdowns. Outflows were most pronounced in North America, where investors yanked out approximately 60 tonnes of gold, the equivalent of $3.2 billion, according to the World Gold Council (WGC). Nevertheless, total global holdings (3,548.5 tonnes, or $191.1 billion) are still slightly up from the start of the year, likely because gold continues to perform well in non-U.S. dollar currencies.
At the same time, it’s been a great year for gold coin sales in the U.S. The WGC reports that the combined sales of the U.S. Mint’s gold American Eagle and American Buffalo coins topped 1.3 million ounces in the nine-month period through September, a 7% increase over the same period last year and the highest total in 22 years.
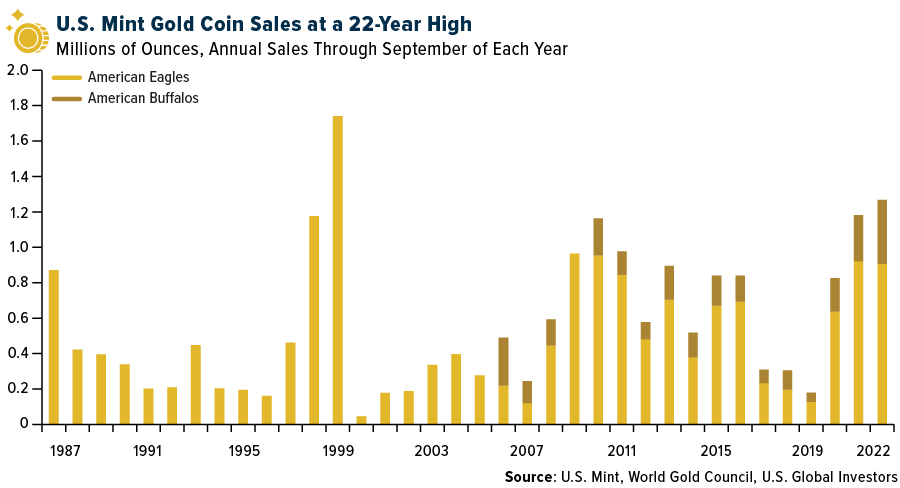
What to make of this? Why have gold-backed ETFs sold off while gold coins have flown off shelves, so to speak?
It’s anyone’s guess, but I believe tangibility plays a large role here. In the past two to three years, world governments and central banks have printed more money than in any other time in history. Investors may rightfully be seeking ownership of hard, tangible assets that 1) are not issued by any central authority, 2) are no one’s liability and 3) cannot be created out of thin air.
As always, I recommend a 10% in gold, with 5% in physical bullion such as American Eagle coins, and another 5% in high-quality gold mining stocks, mutual funds and ETFs.
How much do you know about Diwali? Gold buying and gift-giving are considered auspicious during India’s festival of lights, which happens later this month. Learn all about Diwali by clicking here.
Originally published by U.S. Global Investors on 10 October 2022.
For more news, information, and strategy, visit VettaFi.
The S&P 500 Stock Index is a widely recognized capitalization-weighted index of 500 common stock prices in U.S. companies. The NYSE Arca Gold Miners Index is a modified market capitalization weighted index comprised of publicly traded companies involved primarily in the mining for gold and silver. The MSCI Emerging Markets Index is a free-float weighted equity index that captures large and mid-cap representation across Emerging Markets (EM) countries. The index covers approximately 85% of the free float-adjusted market capitalization in each country. The NASDAQ-100 Index is a modified capitalization-weighted index of the 100 largest and most active non-financial domestic and international issues listed on the NASDAQ. No security can have more than a 24% weighting. The Bloomberg Commodity Index is calculated on an excess return basis and reflects commodity futures price movements. The Bloomberg US Treasury Index measures US dollar-denominated, fixed-rate, nominal debt issued by the US Treasury. Treasury bills are excluded by the maturity constraint, but are part of a separate Short Treasury Index. The Bloomberg US Corporate Bond Index measures the investment grade, fixed-rate, taxable corporate bond market. The Bloomberg Dollar Spot Index tracks the performance of a basket of ten leading global currencies versus the U.S. Dollar. Each currency in the basket and their weight is determined annually based on their share of international trade and FX liquidity.
A basis point is one hundredth of one percent, used chiefly in expressing differences of interest rates.
Holdings may change daily. Holdings are reported as of the most recent quarter-end. The following securities mentioned in the article were held by one or more accounts managed by U.S. Global Investors as of (06/30/22): Tencent Holdings Ltd., Alibaba Group Holding Ltd.
All opinions expressed and data provided are subject to change without notice. Some of these opinions may not be appropriate to every investor. By clicking the link(s) above, you will be directed to a third-party website(s). U.S. Global Investors does not endorse all information supplied by this/these website(s) and is not responsible for its/their content.
