Investors who use a 60/40 portfolio had a rough year. In the past, putting 60% in stocks and 40% in bonds has often helped investors hedge against losses in either asset class. But 2022 had other ideas.
Below is a scatter plot of returns for the S&P 500 (the x-axis) and the Bloomberg U.S. Aggregate Bond Index (y-axis), which tracks a basket of government and corporate debt as well as mortgage-backed securities. In 45 years of data, 2022 ranks as one of the worst years for stocks and the absolute worst year for bonds. Treasuries had their losingest year ever.
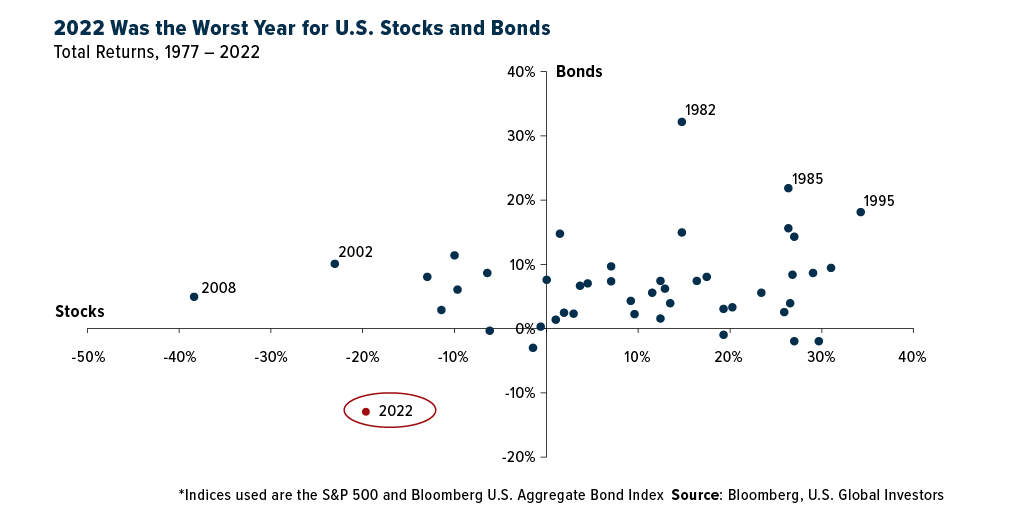
What does this mean for the 60/40 portfolio? This new year, should investors continue to rebalance to reflect 60% stocks and 40% bonds, or is the model broken?
To answer that, it’s important to remember above all else that 60/40 is primarily for long-term investors. There may be hiccups—2002, 2008 and now 2022—but over the long run, these tend to be smoothed out by the better-performing years.
Between 1977 and 2021, the 60/40 mix resulted in an attractive annual equivalent rate (AER) of 11.86% for stocks and 6.92% for bonds, according to Bloomberg data. If we include 2022 in the mix, the AER dips slightly to 11.10% for stocks, 6.45% for bonds.
So going forward, I think 60/40 can still work for many investors who have a long enough timeline and can stomach occasional drops and unexpected swings.
The 10% Golden Rule
Of course, there are many more asset classes to invest in besides stocks and bonds. That includes gold, which I’ve always recommended investors have 10% of their portfolio in—5% in physical bullion, the other 5% in high-quality gold mining stocks, mutual funds and ETFs. I call this the 10% Golden Rule.
In 2022, gold was one of the best assets to have exposure to. The yellow metal was essentially flat for the year, down a negligible 0.28%. That’s despite the U.S. dollar strengthening to its highest level in 20 years.
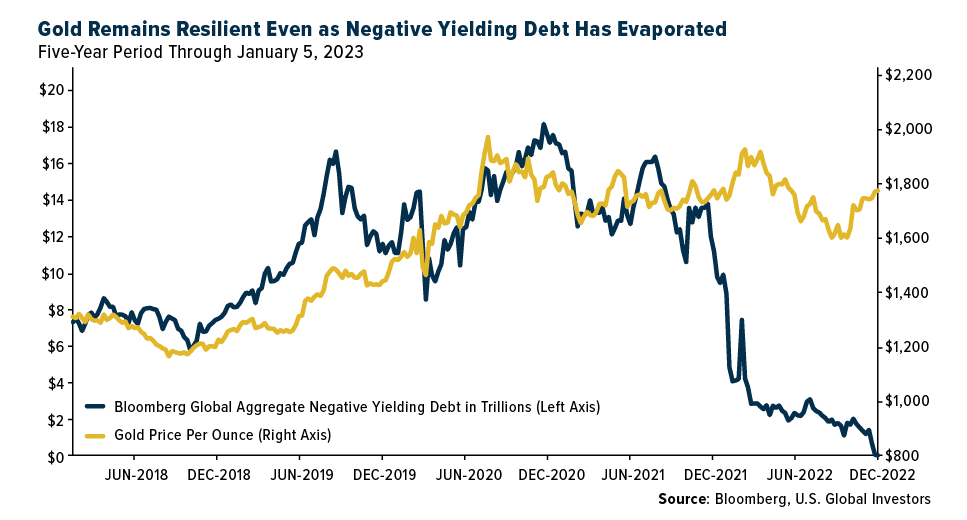
That’s also despite rising bond yields, not just here in the U.S. but across the globe. Remember when the amount of negative-yielding government bonds around the world was $10 trillion, $15 trillion, $18 trillion? That was only two to three years ago.
Today, the amount of government debt that trades with a negative yield has officially dropped to $0.
You would think that in this environment, the gold price would suffer. After all, the precious metal generates no income. And yet, gold has remained incredibly resilient, as you can see below.
I believe gold will continue to perform comparatively well in 2023, especially if we see the Federal Reserve change course. That looks less and less likely, though, as the jobs market in the U.S. remains surprisingly strong. With last Friday’s Bureau of Labor Statistics (BLS) report, December marks the sixth straight month that the number of new jobs created exceeded 264,000.
Have Bonds Peaked? That Would Be Good News For Dividends
Again, bonds had a terrible year, meaning yields spiked. (Bond yields rise when prices fall, and vice versa.) The two-year yield peaked at 4.72% on November 7, the five-year at 4.44% on October 20 and the 10-year at 4.24% on October 24. Since then, all three maturities have contracted as inflation has moderated and interest rate hikes have been smaller than those earlier in the year.
This could be good news for dividend-paying stocks. Many years ago when I worked as a junior analyst, I learned that the five-year yield in particular was correlated with dividend-paying stocks. When the yield on the five-year note built momentum by crossing above its 50-day moving average, dividend-paying stocks became less attractive. And conversely, when the yield fell below the moving average, stocks began to recover.
We’re seeing that play out now. Take a look at the chart below. The S&P 500 Dividend Aristocrats Index, which tracks stocks that have been increasing their dividends for at least 25 years—think legacy companies like Clorox, McDonald’s, Johnson & Johnson and AT&T—hit its 2022 low when the five-year yield was well above its 50-day moving average. Stocks began to rebound when the yield fell below its moving average.
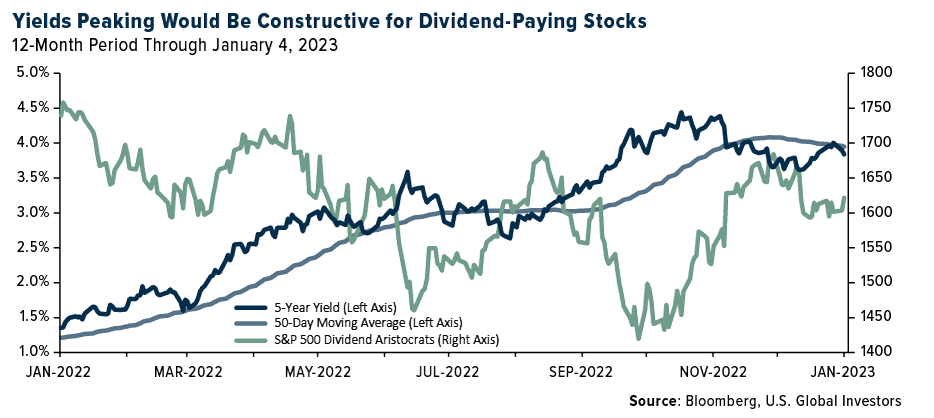
It may be difficult to see in the chart, but the five-year yield is once again trading below the key moving average, meaning momentum is slowing, and I believe this is constructive for dividend-paying stocks.
Asian Airlines Are Soaring
On a final note, I shared with you that the Chinese government has announced a change to its zero-Covid policy; namely, inbound travelers will no longer be required to quarantine upon return. It’s been a long three years, and bookings have soared as Chinese travelers plan to fly overseas.
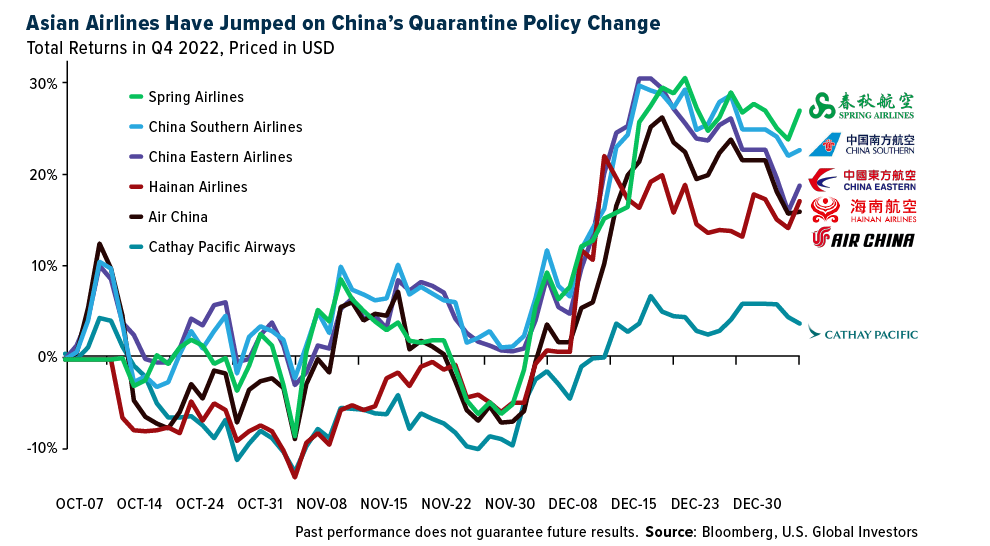
As you can see above, shares of Asian airlines have responded positively, with several jumping 20% in the last quarter of 2022 alone.
Hong Kong’s Cathay Pacific is trailing its peers, but I believe there could be a reversal of fortune as the carrier is currently adding more flights and destinations for its customers. It’s also recently brought back its first class service on certain popular routes for the first time in three years, which sounds like a good reason to celebrate.
Originally published 9 January 2023.
All opinions expressed and data provided are subject to change without notice. Some of these opinions may not be appropriate to every investor. By clicking the link(s) above, you will be directed to a third-party website(s). U.S. Global Investors does not endorse all information supplied by this/these website(s) and is not responsible for its/their content.
The S&P 500 Stock Index is a widely recognized capitalization-weighted index of 500 common stock prices in U.S. companies. The Bloomberg U.S. Aggregate Index is a broad-based flagship benchmark that measures the investment grade, U.S. dollar-denominated, fixed-rate taxable bond market. The index includes Treasuries, government-related and corporate securities, MBS (agency fixed-rate pass-throughs), ABS and CMBS (agency and non-agency). The Bloomberg Barclays Global Aggregate Negative Yielding Debt Market Value Index measures the stock of debt with yields below zero issued by governments, companies and mortgage providers around the world which are members of the Bloomberg Barclays Global Aggregate Bond Index. The S&P 500 Dividend Aristocrats index is designed to measure the performance of S&P 500 index constituents that have followed a policy of consistently increasing dividends every year for at least 25 consecutive years. The annual equivalent rate (AER) is the interest rate for a savings account or investment product that has more than one compounding period.
Holdings may change daily. Holdings are reported as of the most recent quarter-end. The following securities mentioned in the article were held by one or more accounts managed by U.S. Global Investors as of (12/30/22): Air China Ltd.
