
But, these charts barely scratch the surface of the full valuation story. We have to dig a level deeper to the country level, as mentioned earlier, to find out where true value lies.
The table below uses composites of P/S, P/B, P/E, and P/CF to show the average number of standard deviations from historic averages (z-score) for the top 20 countries by market-cap along with respective ETF tickers. Higher values indicate overvaluation, while lower indicate undervaluation. For example, the U.S. absolute valuation is 2.22 standard deviations above the historic average, indicating it is quite overvalued. The data columns represent differences in relativity.
- The “Absolute” column: On an absolute basis, almost every country is trading at above-average valuations. Nothing is cheap (with the exception of Hong Kong). This is not surprising given the strong post-crisis global returns with many markets hitting all-time highs. But, most countries are still below one standard deviation, with none even close to the U.S. market, currently more than two standard deviations above its historic average. Since investing is a relative game, we need to see how these countries compare on a relative basis.
- The “Relative to MSCI All Country World Index (ACWI)” column: This may be the most comprehensive and consistent benchmark to use. There are a handful of countries at above-average valuations, with the U.S. standing out as the highest. But generally, most countries appear attractive, with the U.K. topping the list. There may be some bias here considering the U.S. represents about half of the ACWI Index.
- The “Relative to U.S.” column: Case in point, every country offers great value compared to the U.S. (with the exception of Denmark). Several countries, including the U.K., Canada, and Hong Kong are more than one deviation below average, which helps explain the developed international graph above.
- The “Relative to MSCI ACWI ex-U.S.” column: To determine which countries are undervalued, we need to strip out the U.S. as it is biasing the results due to its high valuations. The U.K., Hong Kong, Canada, and Spain look the most attractive. But, I would not make a blanket statement that Europe is undervalued. Germany, Denmark, Switzerland, and the Netherlands have some of the highest valuations on the list.
Valuations should not be the only consideration when choosing investments, but they are typically a good starting point. While broad international may still be undervalued, there are fewer options for attractive valuations in the world. It is more important than ever to get more granular on exposures. Digging deeper to the country level provides the best opportunity to find value.
![]() Relative Valuation Averages for Top 20 Countries
Relative Valuation Averages for Top 20 Countries
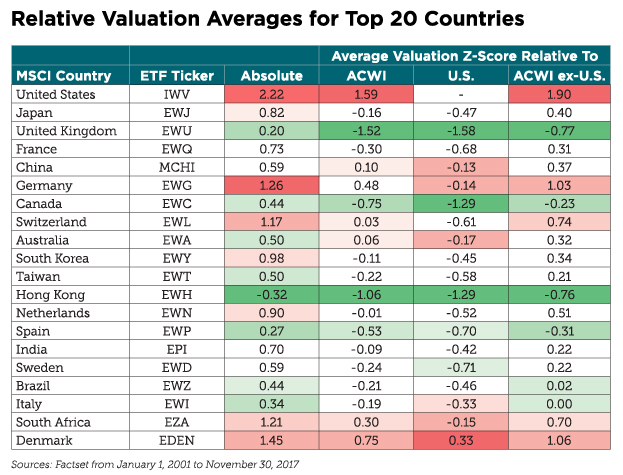
Source: Factset from January 1, 2001 to November 30, 2017
This information is prepared for general information only. Information contained herein is derived from sources we believe to be reliable, however, we do not represent that this information is complete or accurate and it should not be relied upon as such. All opinions expressed herein are subject to change without notice. The graphs and charts contained in this work are for informational purposes only. No graph or chart should be regarded as a guide to investing.
This article was written by Kostya Etus, CFA, Portfolio Manager at CLS Investments, a participant in the ETF Strategist Channel.
3315-CLS-12/27/2017
