
Though financials are 13% of the SPDR S&P 500 ETF (SPY), roughly half the size of the information technology sector, it has been the focus throughout March. Between the regional bank failures, the efforts by the government and larger banks to restore confidence including increased borrowing from the Federal Reserve’s discount window, the impact from the Fed’s latest rate hike, and the GICS changes that reduced the sector’s dependence on banks, there’s a lot going on.
While the Financial Select Sector SPDR ETF (XLF) was recently down 8.9% for the year lagging the 3.2% gain for SPY, it was not the worst performer among S&P 500 based market-cap weighted sector ETFs. Indeed, the Energy Select Sector SPDR ETF (XLE) and the Utilities Select Sector SPDR ETF (XLU) had underperformed as of late March.
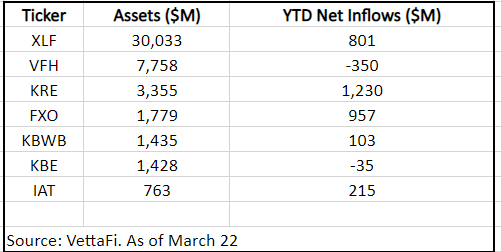
Despite the relatively poor performance, financial ETFs have been in demand, both in terms of flows and increased engagement on VettaFi’s platform. XLF pulled in just over $800 million for the year, with $970 million in the past week perhaps as some feared the worst is behind us, while two smaller ETFs — the SPDR S&P Regional Banking ETF (KRE) and the First Trust Financials AlphaDex (FXO) gathered $1.2 billion and $960 million, respectively. Other popular funds this year included the iShares U.S. Regional Banking ETF (IAT) and the Invesco KBW Bank ETF (KBWB), but there were some funds like the SPDR S&P Bank ETF (KBE) and the Vanguard Financials ETF (VFH) which incurred redemptions.
Meanwhile, traffic to financial sector ETFs and related content on VettaFi platforms (Advisor Perspectives, ETF Database, and ETF Trends) climbed sharply in March relative to January and February according to our new VettaFi Explorer tool for data and analytics. Advisors and end clients wanted to keep up with the market and ETF related developments as well as better get to know these ETFs.
For example, with the addition of Mastercard, PayPal, and Visa, the banking industry exposure to XLF was just 24%, with financial services (33%), capital markets (22%), and insurance (17%) providing diversification. Berkshire Hathaway, BlackRock, and S&P Global are some non-bank top-10 holdings.
Banks represent 26% of assets in FXO, which unlike the market-cap weighted XLF is constructed from a fundamental-momentum-and-valuation-based selection process focused on metrics like book value, relative strength, and revenue growth. Asset managers Franklin Resources, Janus Henderson, and T. Rowe Price Group are top-10 holdings.
Meanwhile, while we think many investors have turned to KRE and IAT for regional banking exposure, the equally weighted KBE has 75% of its assets in the sub-industry, with just 8% in diversified banks and 7% in diversified financial services. New York Community Bancorp is the largest of these regional bank positions, albeit with a 2.1% weight. In contrast, KBWB has 8%-plus stakes in Bank of America, Citigroup, JPMorgan, and Wells Fargo.
Even among the ETFs with “regional bank” in the name, what’s inside is different. IAT is top-heavy and tilted toward the larger-cap banks with 10%-of-assets-plus positions in PNC Financial Services, Truist Financial, and US Bancorp. In contrast, KRE’s top position is also New York Community Bank at 4%, with Citizens Financial, M&T Bank, and Truist Financial around 3%.
As financial stocks and ETFs are likely to stay in the news in April, it is important to understand what makes focused funds unique.
For more news, information, and analysis, visit the Institutional Income Channel.
