
Economic indicators provide insight into the overall health and performance of the economy. They are closely watched by policymakers, advisors, investors, and businesses because they help them to make informed decisions about business strategies and financial markets. The SPDR S&P 500 ETF Trust (SPY) fell 1.01% last week while the Invesco S&P 500® Equal Weight ETF (RSP) was down 0.53%.
Last week, economic data presented a mixed picture as the U.S. economy showed resilience despite persistent inflation. The economy showed solid growth at the end of 2024 while inflation remained sticky, reinforcing the Fed’s cautious approach to monetary policy. Consumer confidence took a hit while housing prices continued to rise, with the S&P CoreLogic Case-Shiller Index reaching new highs.
Meanwhile, the stock market experienced sharp swings. A Monday sell-off sparked by concerns over DeepSeek’s threat to pricey U.S. tech stocks was followed by a rebound as traders reassessed the initial reaction. This was followed by a dip after the Fed’s decision to hold rates steady on Wednesday, before another recovery fueled by strong tech earnings. The potential impacts of President Trump’s tariff policies further added to the volatility, leaving both investors and policymakers weighing the future effects on the economy and markets.
Gross Domestic Product
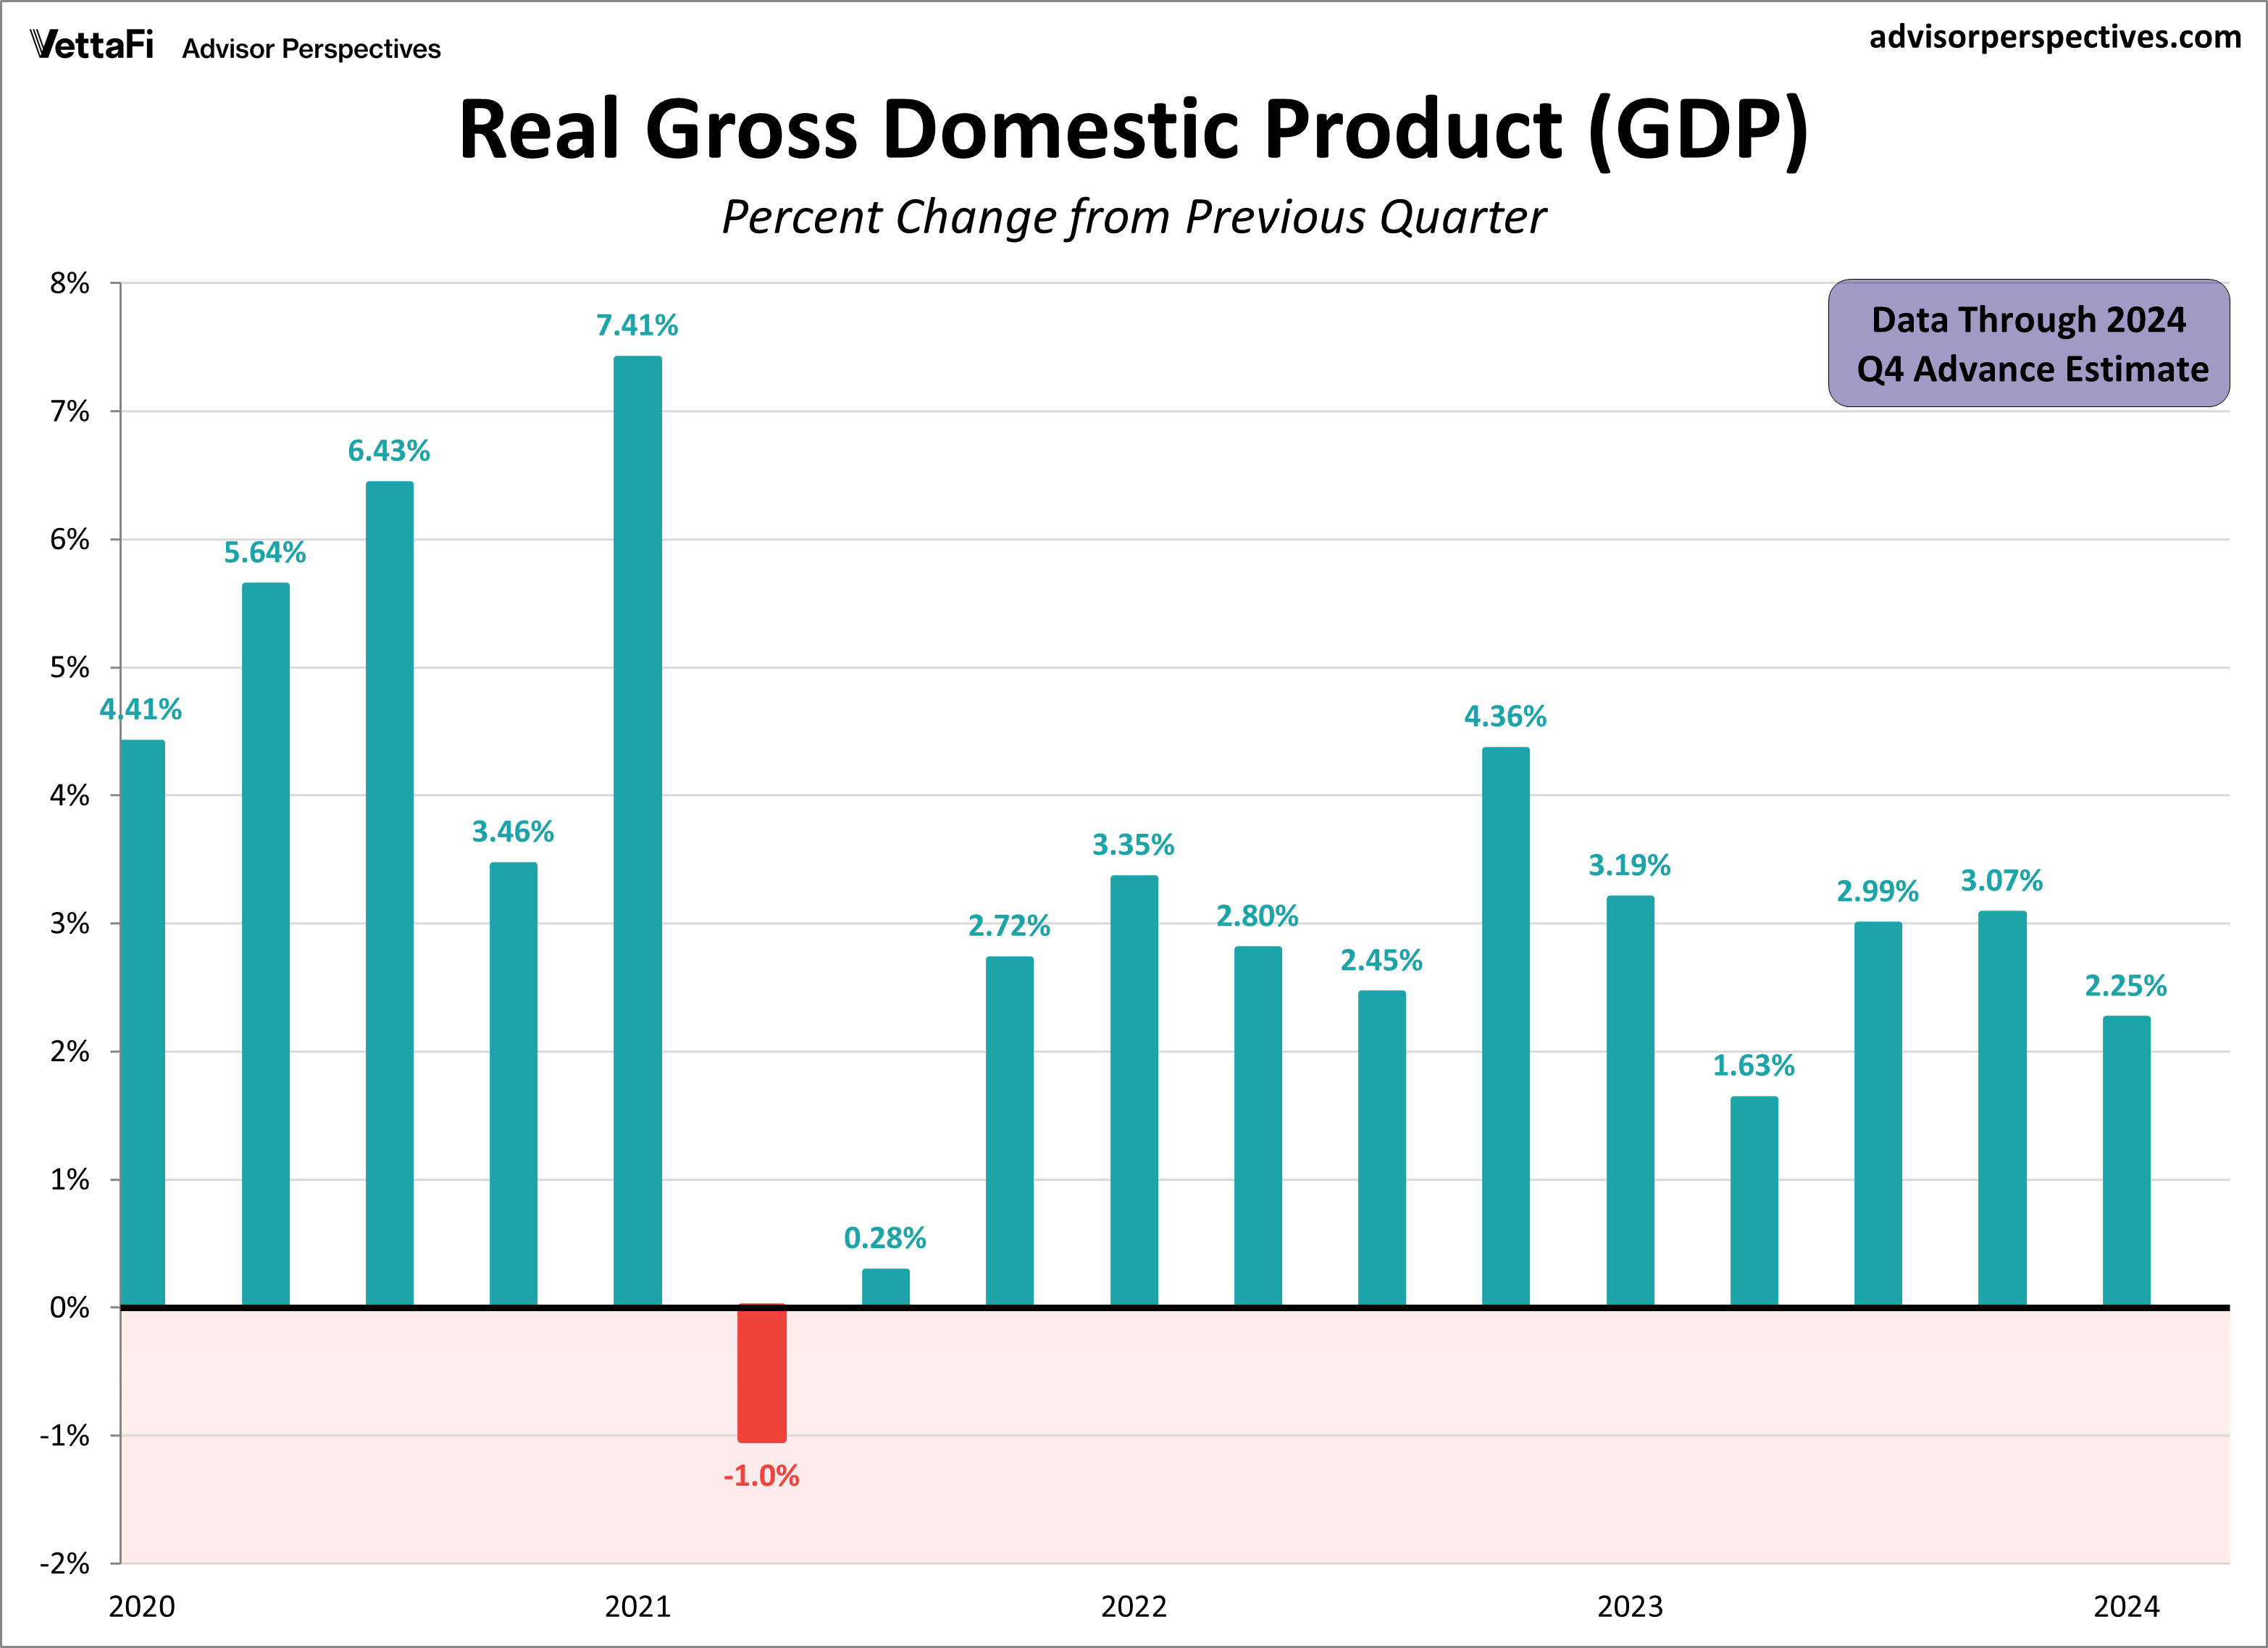
The U.S. economy finished 2024 on solid footing, though growth moderated slightly. According to the advance estimate, real GDP—the inflation-adjusted measure of all goods and services produced in the U.S.—expanded at an annual rate of 2.3% in Q4. While this fell short of the expected 2.7% and slowed from Q3’s 3.1% growth, it still marked the 11th consecutive quarter of expansion, reinforcing how the economy has defied widespread recession fears. The data will be subject to at least two revisions in the subsequent months.
For the full year, GDP grew 2.8%, slightly below 2023’s 2.9% but above 2022’s 2.5%, reflecting another year of steady economic growth. In Q4, three of the four components made positive contributions to real GDP. Consumer spending remained the primary driver, supported by a strong labor market despite ongoing inflation concerns. Government spending also helped drive growth, while a decline in business investment partially offset these gains.
PCE Price Index
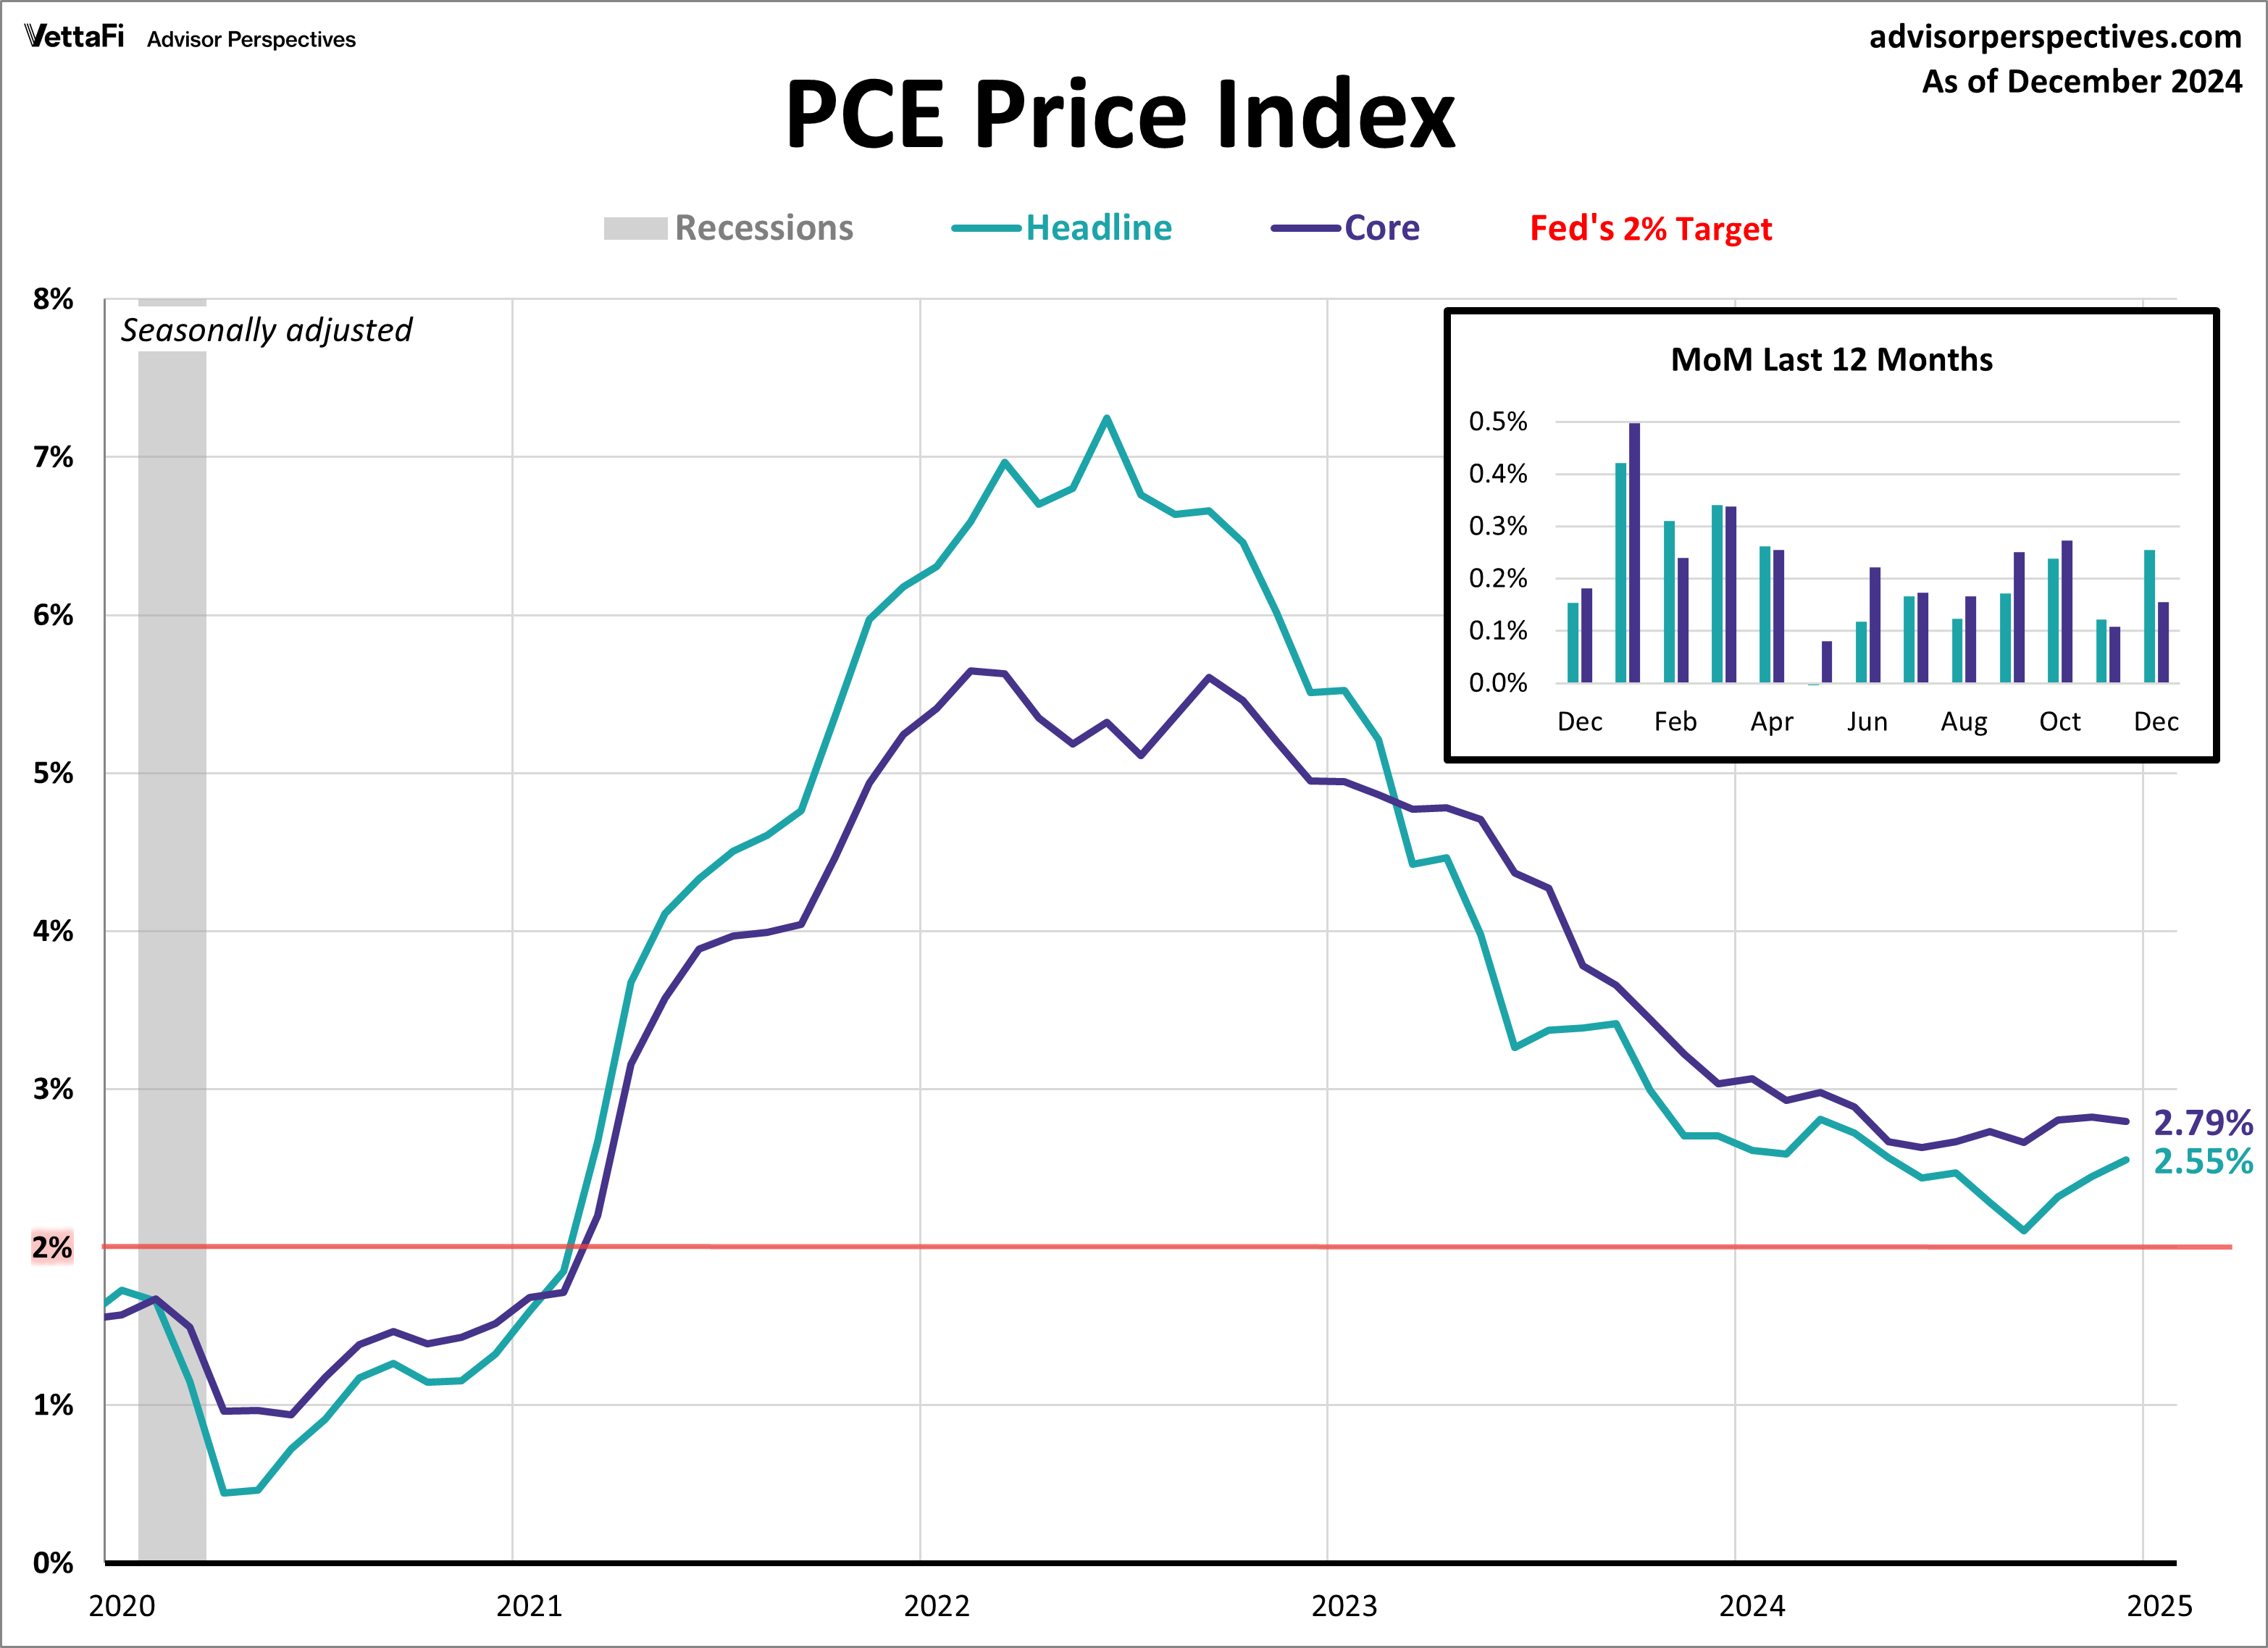
Inflation remained elevated at the end of 2024, reinforcing the Fed’s decision to hold interest rates steady at their meeting last week. The Core PCE Price Index, which excludes volatile food and energy prices, rose 2.8% year-over-year in December, unchanged from November and in line with expectations. On a monthly basis, core prices increased 0.2%, also matching forecasts. Meanwhile, the headline PCE Price Index climbed 2.6% annually—the highest since May—and rose 0.3% from November, marking the largest monthly gain since April.
While the latest data met expectations, inflation remains above the Fed’s 2% target, underscoring the central bank’s cautious stance on rate cuts. Price pressures have eased significantly from their 2022 highs, but the recent stall in progress highlights the persistence of underlying inflation and supports the Fed’s wait-and-see approach.
Consumer Confidence
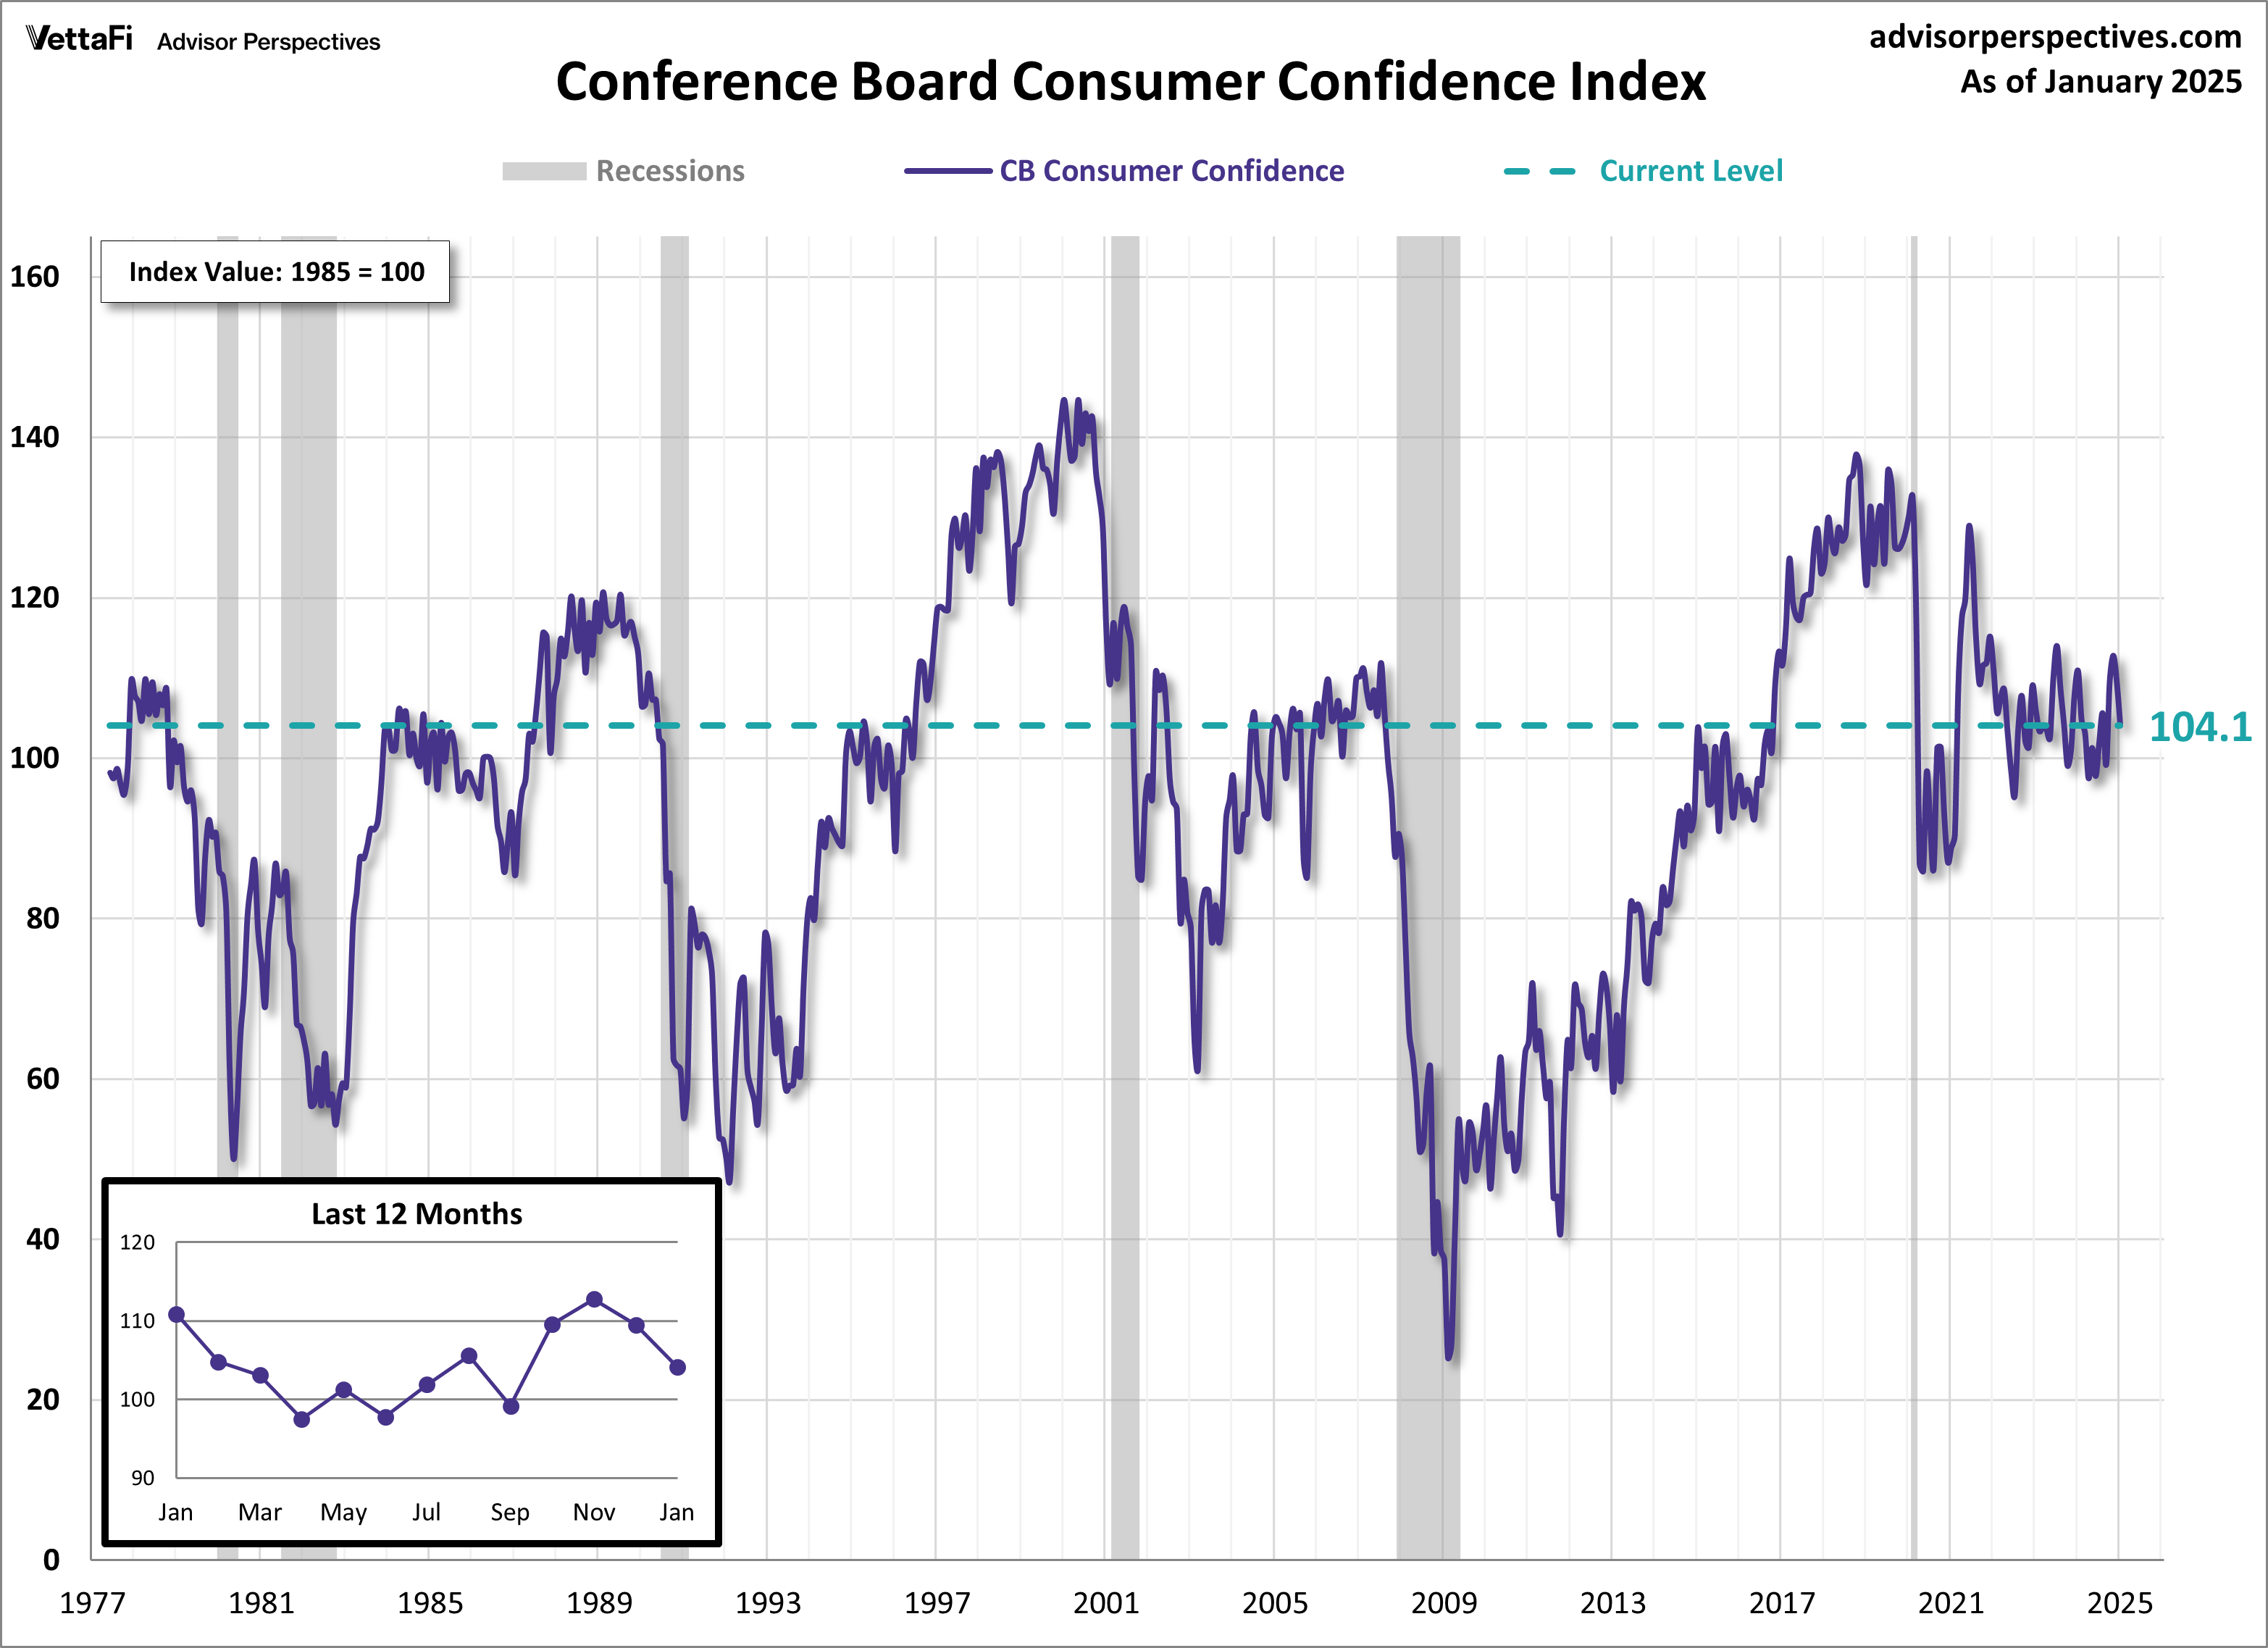
U.S. consumer confidence weakened further in January, as the Conference Board Consumer Confidence Index® fell for the second consecutive month. The index dropped to 104.1, down from an upwardly revised 109.5 in December and below the forecasted 105.7. Concerns around the labor market and inflation drove the decline. However, the index stayed within the narrow 10-point range it’s been in for the past 3.5 years.
The index, based on a monthly survey of consumer attitudes toward current and future economic conditions, showed deterioration across all five components in January. The Present Situation Index saw the sharpest drop, with consumers reporting weakening business conditions and a more negative view of the labor market. Future expectations also dimmed, with more pessimism surrounding income, business conditions, and employment opportunities. Furthermore, 12-month inflation expectations rose, with “inflation” and “prices” dominating consumer write-in responses. More than half of respondents anticipate higher interest rates in the year ahead.
Despite the overall decline, there were some positives from the survey that were not included in calculating the index. Consumers’ views on their family’s current financial situation were positive. Views on their family’s expected financial situation reached a new high. Additionally, the proportion of consumers expecting a recession in the next 12 months stayed near the series low. More than half of consumers continued to express bullish sentiments about the stock market.
The Consumer Discretionary Select Sector SPDR ETF (XLY) is tied to consumer confidence.
S&P Case-Shiller Home Price Index
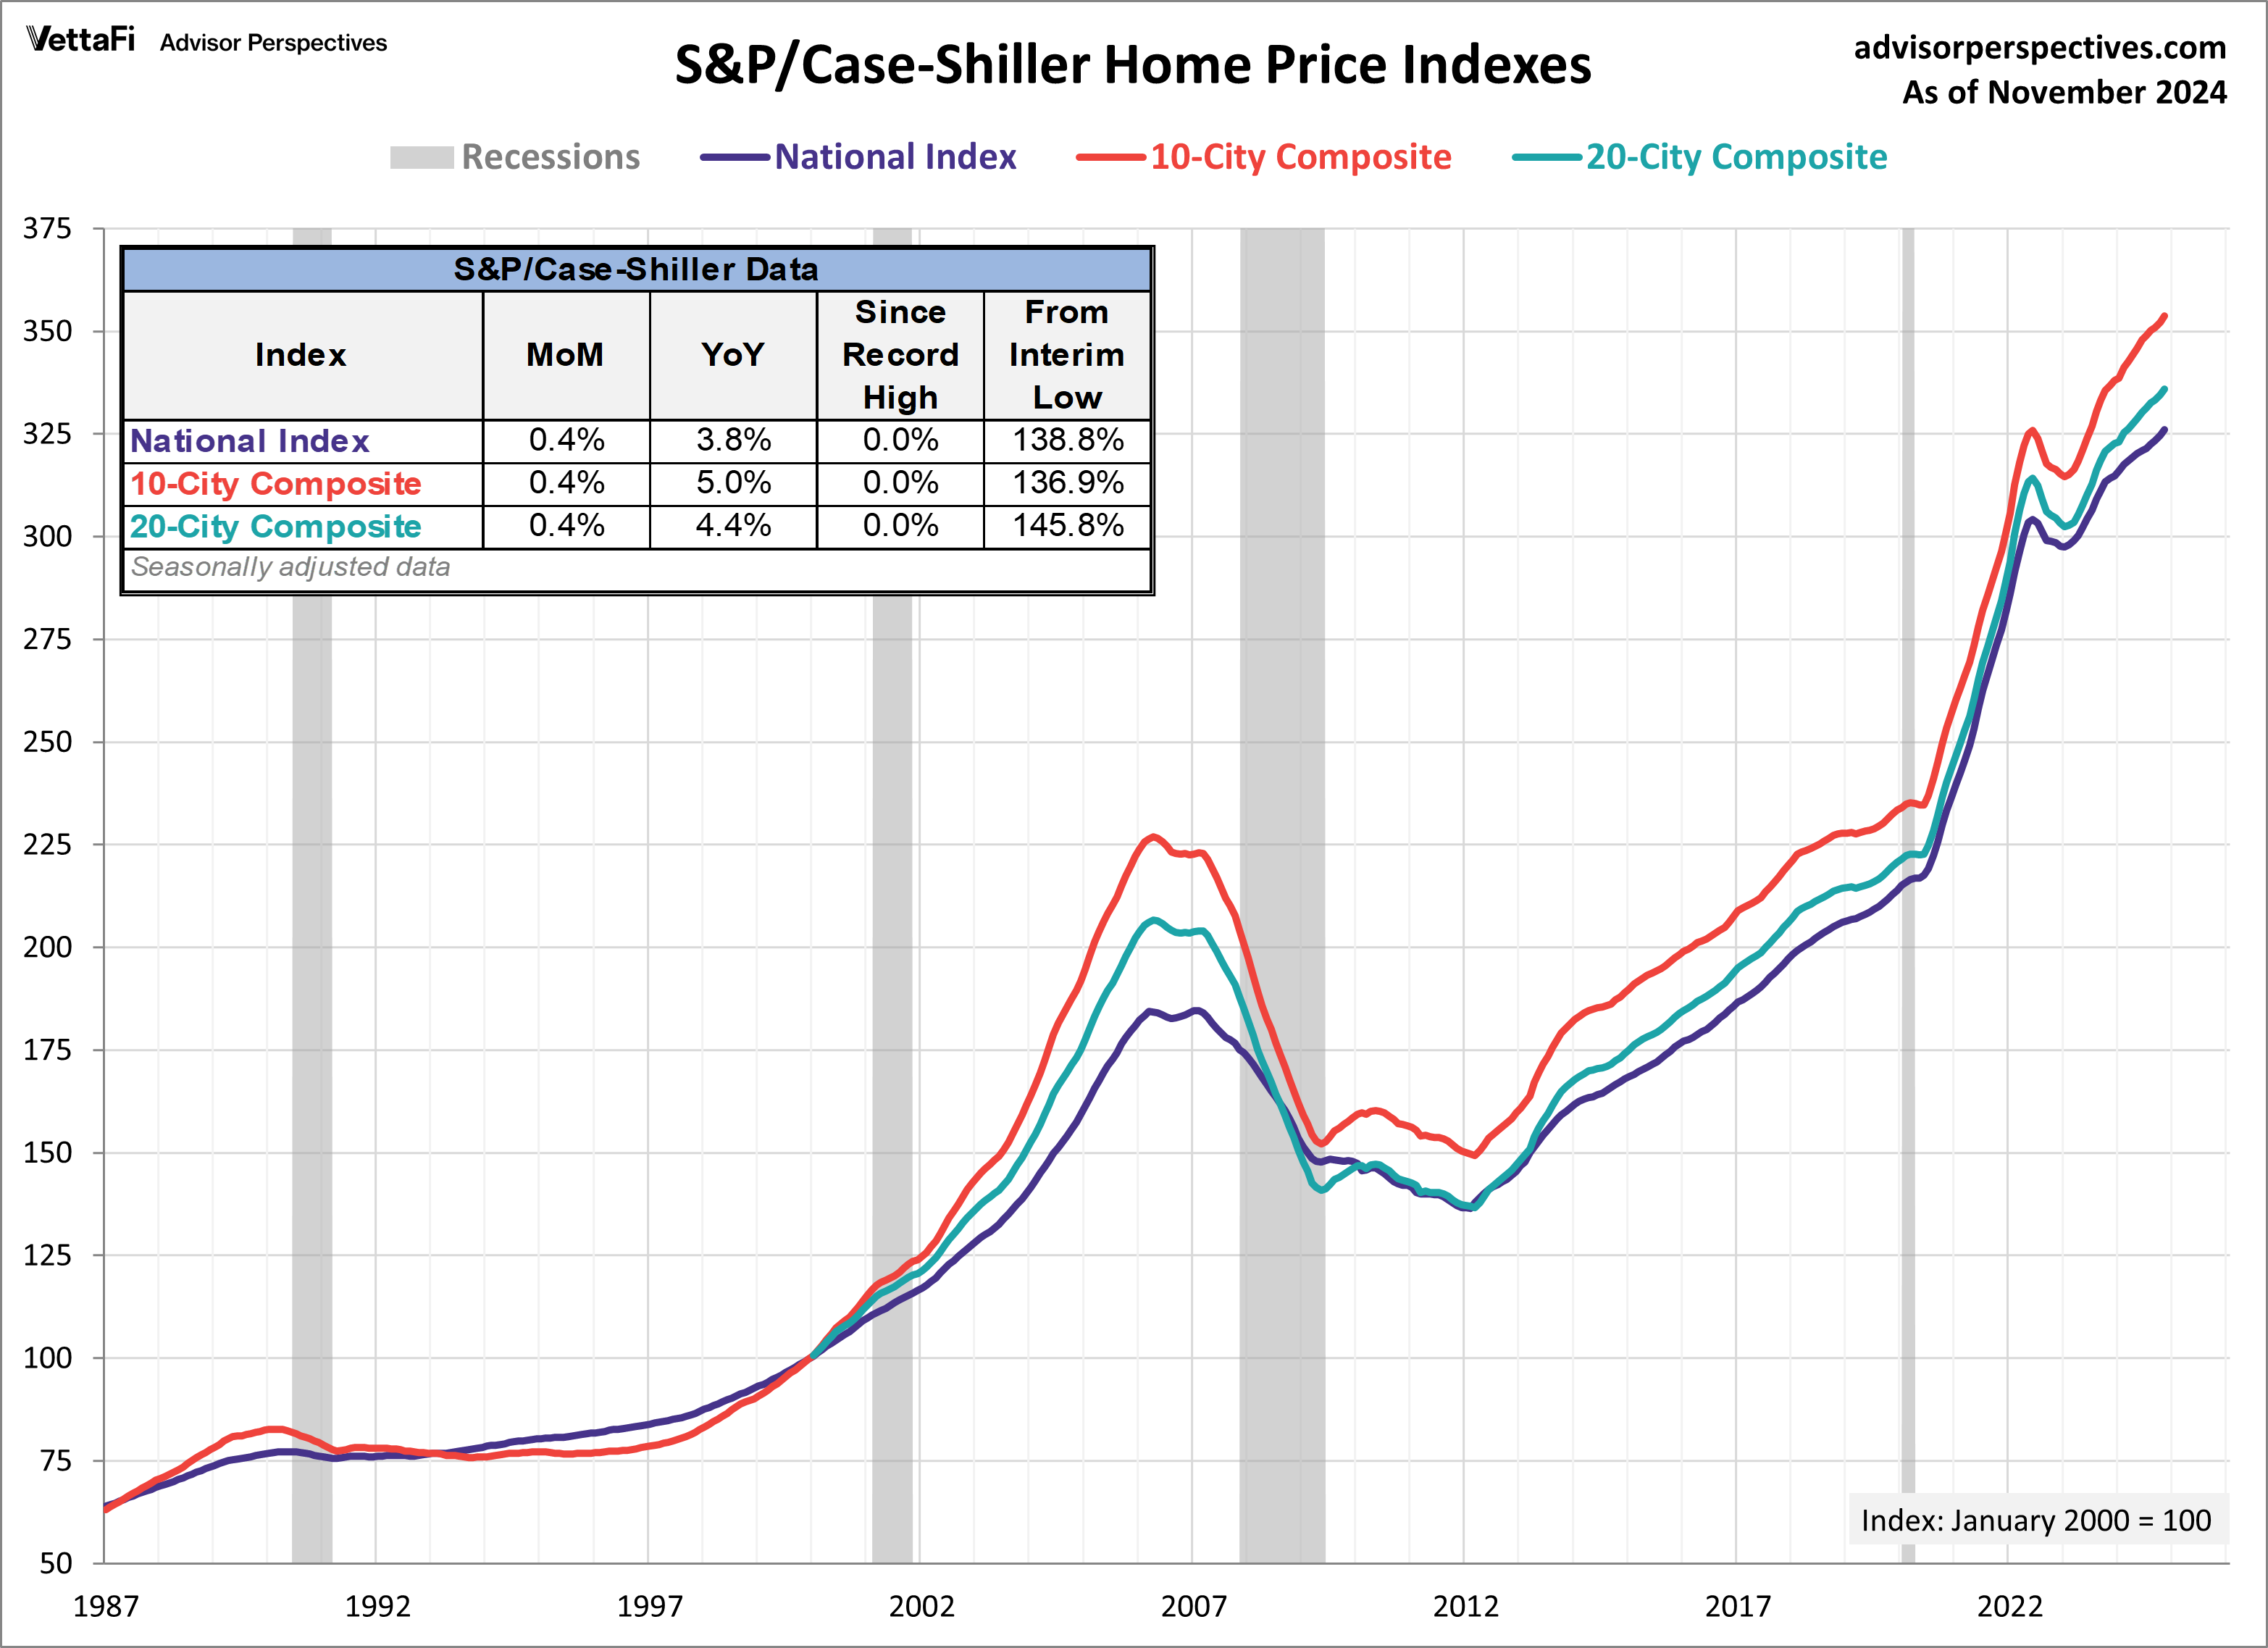
U.S. home prices continued to rise in November, albeit at a slower pace. The S&P CoreLogic Case-Shiller National Home Price Index increased for the 22nd consecutive month, reaching yet another all-time high—the 18th in a row. The national index was up 0.4% from October and rose 3.8% year-over-year.
The S&P CoreLogic Case-Shiller Home Price Indices are widely regarded as benchmarks for housing prices in the U.S., tracking changes in residential real estate values. Alongside the national index, the 20-city and 10-city indexes also reached new all-time highs in November. The 20-city index was up 0.4% from October and rose 4.4% annually. The 10-city index was also up 0.4% month-over-month and increased 5.0% year-over-year.
Market and Fed Reactions
The S&P 500 see-sawed through a data-packed week but ultimately closed with a 1.0% loss. Volatility was driven by a mix of major developments. These include the DeepSeek threat, the Federal Reserve’s latest decision, big tech earnings, and renewed uncertainty over Trump’s tariff policy. The index is up 2.93% year to date. Meanwhile, the S&P Equal Weight Index fell 0.3% from the previous week and is up 3.84% year to date.
The 10-year Treasury yield finished the week lower at 4.58% while the 2-Year note finished lower at 4.22%.
In their meeting last week, the Fed held rates steady at 4.25-4.50%, marking the first time in four meetings that the Fed did not cut interest rates. According to the CME FedWatch Tool, markets currently anticipate two 25 basis point rate cuts for 2025. The first is expected to take place at the June 18th meeting. The second is projected for the December meeting later on in the year.
Economic Data in the Week Ahead
The first week of a new month means a fresh look at the labor market. December’s JOLTS report kicks things off on Tuesday, followed by ADP’s private payroll data on Wednesday. The main event, however, will be Friday’s BLS nonfarm payrolls report. It will provide the most comprehensive snapshot of job growth. Beyond employment data, S&P Global and the Institute for Supply Management will release their latest Manufacturing and Services PMI readings, offering insight into economic activity in the manufacturing and services sectors. To close out the week, the University of Michigan will publish its preliminary consumer sentiment report for February.
For more news, information, and strategy, visit the Innovative ETFs Channel.
