
By Todd Rosenbluth, CFRA
Despite growing adoption of ETFs for asset allocation purposes, emerging market ETFs have been out of favor. The three largest U.S. listed emerging market ETFs incurred $14 billion of redemptions year-to-date through July 10 with investors favoring U.S. equity focused funds. iShares Core MSCI Emerging Markets (IEMG) was least popular of the trio with $5.5 billion of net outflows—and had the fourth highest outflows across ETF categories—but iShares MSCI Emerging Markets ETF (EEM) ($4.6 billion) and Vanguard FTSE Developed Markets ETF (VW) also lost ground in 2020. In years past, IEMG took market share from its more expensive iShares sibling EEM as investors favored the lower-priced IEMG, but this trend has been broken. Meanwhile, it has been rare for a Vanguard offering to be among the ten largest outflows, but VWO had the fifth highest outflows in 2020.
CFRA believes holdings — more than fees — drive ETF performance. These three emerging market ETFs track different indices and provide unique exposure. The exposure distinctions help explain not only the past performance records but also provide insight into the prospects. CFRA’s ETF star rating methodology combines holdings-level analysis and fund attributes, including costs and the record to ascertain the risk and reward potential. While all three ETFs earn a CFRA three-star rating, VWO has the best cost score, while EEM has the safest risk score.
VWO tracks a FTSE Russell index that includes China (42% of end of May assets), Taiwan (15%), India (9.4%), and Brazil (5.9%), but not South Korea as the latter country is classified as a developed market. In contrast, IEMG and EEM track different MSCI indices and incorporate exposure to CFRA Buy recommended Samsung Electronics and other South Korean domiciled companies. IEMG has slightly more exposure to Taiwan (13.0% vs. EEM’’s 11.9% as of July 9) and South Korea (11.4% vs. 10.8%) and less exposure to China (39.5% vs. 42.4%) as IEMG tracks a broader index with double the holdings and includes smaller cap companies.
Chart 3: Geographic Exposure of Emerging Market ETFs (%)

CFRA rates some smart-beta emerging market ETFs higher, despite their smaller size. In recent years, asset managers have launched emerging market ETFs that incorporate fundamental and price-based screens, offering a twist on the market-cap weighted EEM, IEMG, and VWO.
CFRA four-star rated $1.7 billion Goldman Sachs Active Beta Emerging Markets (GEM) and five-star rated $282 million JP Morgan Diversified Return Emerging Markets Equity ETF (JPEM) are two such examples. We find both ETFs incur less risk than more established peers and are positioned to outperform the broader Global Equity ETF category over the next nine months.
Chart 4: Geographic Exposure of Smart-Beta Emerging Market ETFs (%)
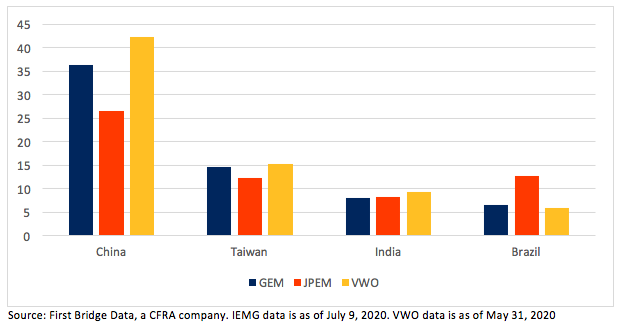
Both ETFs tracks indices that incorporate quality, value, and momentum screens. GEM also includes a low volatility factor, while JPEM is constructed using a risk-reduction focus. Each has less exposure to China (36% for GEM and 27% for JPEM) than VWO and JPEM’s weighting to Brazil (13% of assets) further highlights the country differentiation that stems from the bottom-up selections.
Conclusion
Emerging market equity ETFs have been out of favor in 2020, despite providing diversification benefits. IEMG took market share from VWO and fellow iShares ETF EEM in the last few years, but all three funds have recently incurred redemptions. While each fund has some favorable attributes and provides different exposures, CFRA rates smaller GEM and JPEM higher and believes these funds also warrant attention.
Todd Rosenbluth is Director of ETF & Mutual Fund Research at CFRA.
