
By Senior Director, Strategy Indices, S&P Dow Jones Indices
Risk appetite returned in the second quarter of 2020, spurred by the easing of COVID-19 lockdowns and aggressive economic stimulus measures. The S&P 500® rebounded, finishing the quarter up 20.5%, and yields on U.S. Treasuries saw little change. In commodities, the S&P GSCI rallied, with energy posting a sharp gain as oil-producing countries agreed on temporary production cuts.
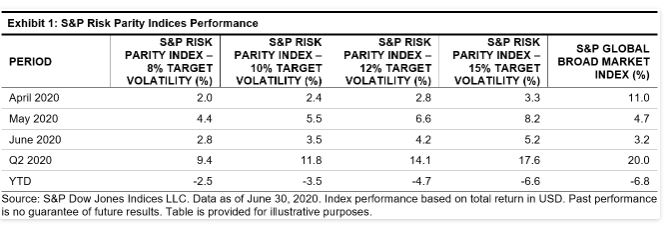
During this time, the S&P Risk Parity Indices recovered most of the ground lost in the first quarter of 2020 (see Exhibit 1). The S&P Risk Parity Index – 10% Target Volatility posted a gain of 11.8% in the second quarter and was down 3.5% for the first half of the year.
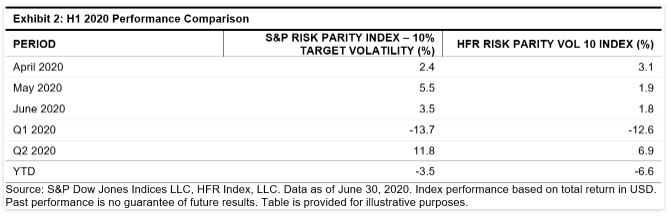
Notably, the performance of the S&P Risk Parity Indices exceeded that of the manager composite, which is represented by the HFR Risk Parity Vol 10 Index. For reference, the HFR Risk Parity Indices represent the weighted average performance of the universe of active fund managers employing an equal risk-contribution approach in their portfolio construction.
While the S&P Risk Parity Index – 10% Target Volatility was on par with the HFR Risk Parity Vol 10 Index in the first quarter, it significantly outperformed in the second quarter by 4.9% (see Exhibit 2).
While it is hard to pinpoint the exact source of outperformance, the S&P Risk Parity Indices were well positioned to benefit from the rebound. Since they utilize a long look-back window (15 years) to determine asset class weights and leverage, their allocations remained fairly consistent throughout 2020.
As Exhibit 3 shows, the normalized asset class weights remained relatively unchanged YTD. Furthermore, the leverage decreased only slightly following the volatility spike in March 2020, meaning the S&P Risk Parity Indices did not miss out on the recovery in the second quarter.

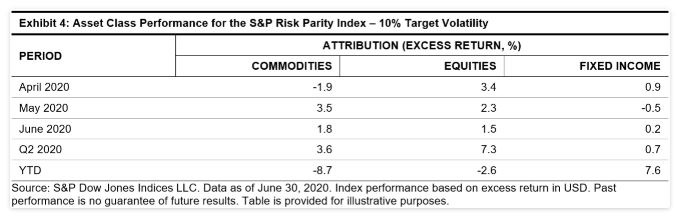
It is also interesting to examine the asset class performance attribution of the S&P Risk Parity Index – 10% Target Volatility (using excess returns). The S&P Risk Parity Indices comprise three asset class sub-components: equities, fixed income, and commodities.
As Exhibit 4 shows, the positive performance in the second quarter of 2020 was driven by commodities and equities, up 3.6% and 7.3%, respectively. Year-to-date, the fixed income component posted meaningful positive performance, up 7.6%, but this was not enough to completely offset the other asset classes, particularly commodities, which was down 8.7% over the first half of the year.
Following the historic first two quarters for markets in 2020, it’s anyone’s guess as to what the rest of the year will bring. Investors will have to weigh reasons for optimism with reasons for caution. A well-diversified portfolio such as our S&P Risk Parity Indices may be appealing to those who don’t want to put all their eggs in one basket.
