
By Paul Wong, CFA, Market Strategist, Sprott
Gold bullion[1] is down 8.66% YTD through February 28, 2020, but is up 9.36% YOY. Gold mining equities[3] have fallen 16.78% YTD but have increased 11.37% YOY. Silver[2] and platinum[19] are the precious metals standouts for the recent period, up 1.01% and 11.28% YTD, and 60.02% and 37.71% YOY, respectively. This compares to 1.72% YTD and 31.29% YOY returns for the S&P 500 TR Index.[6]
Month of February 2021
| Indicator | 2/28/2021 | 1/31/2021 | Change | Mo % Chg | YTD % Chg | Analysis |
| Gold Bullion[1] | $1,734.04 | $1,847.65 | ($113.61) | (6.15)% | (8.66)% | The worst month since 2016 as real rates rise |
| Silver Bullion[2] | $26.67 | $26.99 | ($0.32) | (1.18)% | 1.01% | Silver continuing to hold firm |
| Gold Senior Equities (SOLGMCFT Index)[3] | 113.05 | 128.61 | (15.56) | (12.10)% | (16.78)% | Gold equities back to summer breakout |
| Gold Equities (GDX)[4] | $31.13 | $34.51 | ($3.38) | (9.79)% | (13.58)% | (Same as above) |
| DXY US Dollar Index[5] | 90.88 | 90.58 | 0.30 | 0.33% | 1.05% | Still near the lows |
| S&P 500 Index[6] | 3,811.15 | 3,714.24 | 96.90 | 2.61% | 1.47% | Back to 50 daily moving average |
| U.S. Treasury Index | $2,488.92 | $2,534.92 | ($46.00) | (1.81)% | (2.75)% | Bond source of risk and volatility |
| U.S. Treasury 10 YR Yield | 1.40% | 1.07% | 0.34 | 31.85% | 53.84% | Sharp sell-off, touching 1.60% |
| U.S. Treasury 10 YR Real Yield | (0.75)% | (1.04)% | 0.29 | 28.11% | 31.68% | Back up driven by nominal yields |
| Silver ETFs (Total Known Holdings ETSITOTL Index Bloomberg) | 964.38 | 939.62 | 24.76 | 2.64% | 8.65% | Silver maintaining accumulation |
| Gold ETFs (Total Known Holdings ETFGTOTL Index Bloomberg) | 104.18 | 106.85 | (2.67) | (2.50)% | (2.41)% | Four outflow months in a roll |
Gold Blues as Silver Woos
February was a tough month for gold, which marked its worst monthly performance since November 2016. Spot gold fell $114/oz, or 6.15%, to close the month at $1,734/oz. Half of this decline came in the two final days of February, as bond selling spiked into near panic mode and triggered a multi-asset sell-off into month-end. Figure 1 shows how gold has been inversely correlated to bond yields.
February’s pullback occurred on the back of various developments. Rising energy prices and the markets’ view on U.S. government spending bolstered the reflation trade with a rally in broader equity markets. The U.S. dollar strengthened as markets priced in a swift economic recovery and as U.S. Treasury yields advanced to the highest level in a year, with the 30-year bond rising above 2% and the rapid move in the 10-year to over 1.5%, which we will discuss in more detail. Meanwhile, gold ETFs saw holdings decline towards the end of February. Silver prices held up much better as markets sought out physical ownership and recognized silver’s undervalued economic merits. Gold stocks were drawn down in a volatile fashion with the gold price move. Precious metal equities followed physical metals’ performance, with silver related stocks outperforming gold stocks.
February Ends with a Full Blown Tantrum
For the past several years, Federal Reserve (Fed) policies have driven yields continually lower, and as a result, most asset classes now have embedded duration effects. For gold, this duration effect is in the real yield. The sudden backup in real interest rates was shockingly quick ― nearly 40 basis points in six trading sessions. The rise in real yields was driven almost exclusively by the rise in nominal rates on the back of term premiums (expectations) backing up. There is just no escaping the pervasive effects and consequences of central bank policies in any asset class.
Since August 2020, the U.S. 10-year Treasury nominal yield has been rising, which the Fed has viewed as benign and as a sign of better growth, as rising breakeven yields led it.[7] Just in case, the Fed would reiterate that it was not even thinking about raising rates, and with its new AIT (average inflation targeting) policy, that it would be a long time before the Fed would raise interest rates even in the face of rising inflation. But once 10-year U.S. Treasury yields rose above 1.20%, the bond market began to sell-off and closed out February with a full-blown “taper tantrum.”[8]
Figure 1. Gold’s Decline Tracks Rise in 10-Year U.S. Treasury Yields
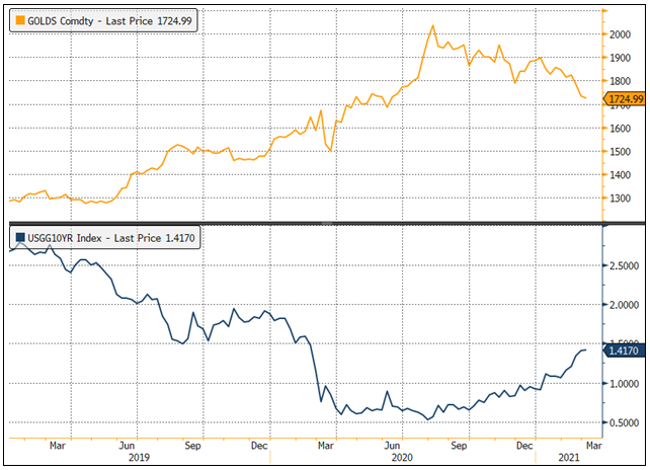
Source: Bloomberg. Data as of 3/1/2021. Gold is measured by the Bloomberg GOLDS Comdty Index. 10-Year Treasuries are measured by the Bloomberg USGG10YR Index.
The Reflation Narrative Continues to Grow
Since early January, the reflation narrative has continued to build, igniting a growing bear steepener trade (investors demanding higher yields in longer-dated bonds to offset the risk of growth and inflation). By the last week of February, tail hedgers had switched from bear steepeners to bear flatteners (yields rising in the curve’s middle or belly). Also, new short positions were established in three-year Eurodollar futures (greens).[9] These two trades signaled that the Fed would need to tighten (raise rates) way ahead of its stated schedule. Furthermore, this tightening would be by way of tapering QE (quantitative easing), which would impact the belly of the U.S. Treasury curve the most (the bear flattener trade). When CTAs[10] flipped to bearish (mechanical selling), this compounded the selling pressure. The final catalyst was the failure of last Thursday’s (February 25) 7-year U.S. Treasury note auction. Investors showed tepid demand for the $62 billion worth of notes, with the bid-to-cover ratio at just 2.04, the lowest in the auction’s history. In response, the U.S. 10-year Treasury yield exploded higher to reach 1.6085% but reversed sharply to close at 1.40% for the month, likely a climactic selling spike.
Not lost on the market was that three-year Treasury yields rose the most last Thursday (2/25/2021) , climbing nine basis points. Fed policy should have kept this part of the yield curve nailed to the floor, and the Fed’s failure to do so brought into question its creditability. Not helping was the Fed’s silence into the month-end taper tantrum selling panic. If the bond market remains unstable in the near term, we would expect some Fed jawboning. If that were not enough, then the next step would be WAM (weighted average maturity) extension and possibly a change in QE composition. Currently, the Fed is buying $80 billion in Treasuries and $40 billion in mortgage-backed securities each month. The Fed can shift towards more Treasury purchases. The Fed can also bring up the YCC (yield curve control) debate again and wave that at the market. But the bigger question is: Have we reached the point where U.S. 10-year Treasury yields at only 1.50% and 10-year real yields at -0.75% are a threat to the bond market’s stability? Or is instability due to rates moving too fast, too quickly?
Looking at the flipside extreme, what would happen if the Fed decides (or were forced) to increase WAM, QE and bring in some form of YCC? This would likely mean unlimited liquidity for equities, low yields across the curve to finance all fiscal programs and corporate bond spreads would narrow even more. It would also be the last nail in the coffin for price discovery. Markets would soar until the weight of unsustainability causes a systematic market crash that wipes out the majority of wealth — this is one of the extreme right-tail risk events we highlighted in our November commentary, Gold Tests $1,800 Support.
Bullish View on Gold Remains Intact
Although we are disappointed by gold’s recent price weakness, we recognize that market flows, positioning and momentum can dominate price action in the near term in today’s market environment. The last week of February was an uncomfortable replay of the 2013 Taper Tantrum in a condensed form. Two scenarios are likely going forward. One is that the Fed will taper, and yields will rise. The second is that the Fed stays the course.
The Fed taper scenario is a total non-starter. Here’s why. If the Fed were to truly taper, real yields would rise dramatically. Figure 2 highlights the relationship between the S&P 500 forward P/E multiples[11] and the 10-year real yield over the past five years (the R-squared is 73%).12 Not only would P/E multiples collapse, but earnings expectations would see headwinds as higher yields bite into the earnings outlook. Rising real yields would strengthen the U.S. dollar (USD), further tightening financial conditions. In this scenario, the stock market would likely enter a bear market given current dot-com-level valuations. Without the current high QE level, further fiscal expansion programs would come to a halt, and GDP (gross domestic product) growth expectations would hit the wall. Under this taper outlook (basically, the Fed no longer providing full support), one would reduce exposure in equities, bonds, commodities, gold and everything else. The corollary argument is that growth is now so strong and established (despite being in the early stages of the post-COVID recovery) and is now impervious to any taper action. This would go against the entire notion and purpose of AIT (average inflation targeting). Despite the recent tantrum, the Fed fully controls the world’s reserve currency’s printing press (USD). The Fed is the boot, and bond vigilantes remain the ant (remember The Avengers from 2012?). All tantrums will come to an end, including this one.
Figure 2. S&P 500 Forward P/E Multiples and 10-Year Real Yield Relationship

Source: Bloomberg. Data as of 2/28/2021.
Rising Volatility Benefits Gold
By staying the course, the market’s significant risk would be inflation, which is what the Fed is trying to engineer, and why the bond market is in a tantrum. It is not surprising that the bond market reacted in this manner; it is now the primary source of market risk and volatility. Staying the course will mean continuing massive fiscal stimulus leading to ever-expanding M2 money supply[13] and continuing deep negative real yields and a weak USD. The yield curve has already steepened and will likely climb higher in the face of such fiscal spending. Figure 3 highlights the relationship between the 2s10s Treasury yield curve,[14] the MOVE Index (implied bond volatility)[15] and the VIX Index.[16] Historically, the yield curve is the best predictor of the MOVE Index direction. For several years, the MOVE Index had been relatively constrained by Fed policy, which has now come to an end. An untethered MOVE Index will increase cross-asset class volatility (MOVE and VIX generally move together).
Rising volatility in all asset classes will place a greater demand for effective hedges and diversification. Our 2021 Top 10 Watch List commentary highlighted all these points (M2 growth, real yields, USD and market volatility) and their relationship to gold. The long-term trends remain in place for a bullish gold view.
Figure 3. 2s10s Treasury Yield Curve, MOVE Index and VIX Index
Source: Bloomberg. Data as of 2/28/2021.
Fed Guidance will Impact Short-Term Price Action of Gold
Since the summer peak, we were looking for gold to maintain the support level at $1,800 or “stickiness” around $1,800. That level would have been a high-level support price similar to what silver is experiencing. The $1,800 level gave way in the final two days of February and has fallen to the first Fibonacci retracement, or support, at $1,725 and is still above the trendline from the 2018 lows (Figure 4). The gold price is also sitting in a cluster of support, marked by the blue dashed lines. The upper blue dash line marked the resistance level before the August melt-up to the peak.
Despite the gyrations, gold remains in a bullish trend but is now testing critical medium-term support levels. The relative strength index (RSI)[17] is at extreme oversold levels consistent with prior tradeable lows (bottom panel, red circles). The movement in yields and Fed guidance will likely determine the short-term price action of gold bullion. There are plenty of technical indicators showing yields have reached a short-term climactic blow-off action. Longer-term, the probability of an early Fed taper seems unlikely, but gold has discounted some of this already.
Figure 4. Gold Bullion Testing First Fibonacci Support and Trendline
Source: Bloomberg. Data as of 2/28/2021.
More Trouble with Bonds, Asset Allocation View
For decades, bond yields have been in one of the most prolonged secular declines in history. In recent decades, when a financial stress event or calamity occurred, central banks quickly cut interest rates. In terms of the Fed’s reaction function’s prime beneficiary, it has been consistently bonds. Post the GFC (global financial crisis), bonds had morphed to become increasingly negatively correlated to equities and had become the best hedge in a multi-asset portfolio. But with ZIRP (zero interest rate policy), the ability of bonds to act as a hedge is likely gone unless the Fed is willing to go negative on yields. Bonds will still work as a diversifier, but the difference between a hedge and a diversifier is cavernous in any value-at-risk (VaR) based scenario.[18] Figure 5 highlights how extraordinarily well this hedge function worked before ZIRP. Ideally, the price correlation between assets should be negatively correlated in a pronounced manner.
Using the SPDR S&P 500 ETF (SPY) as the equity and the iShares 20+ Year Treasury ETF (TLT) as the bond, from January 2017 up until the Fed going to a ZIRP in March 2020, there was a very marked negative correlation pattern between SPY and TLT (blue line). Perhaps almost as necessary, the volatility of equities (VIX) and bonds (MOVE) should be highly positively correlated so that volatility events are aligned. The upper and lower green dashed boxes mark this extraordinary period of hedge protection. Since the start of ZIRP, the correlations of both SPY-TLT and VIX-MOVE have broken, and it is clear the hedge function is gone. As a result, we see more asset classes, such as gold, being added to multi-asset portfolios to increase overall portfolio diversification without an effective hedge.
Figure 5. Price and Volatility Correlation of Equities and Bonds (Rolling 30-Day Correlation)
Source: Bloomberg. Data as of 2/28/2021.
Bitcoin: Take A Walk on the Wild Side
Before the end-of-month bond market tantrum, the most extraordinary story in February was Bitcoin. Since autumn, Bitcoin has increased fivefold based on… we are not entirely sure exactly what, exactly. Typically when a security rises fivefold to top $1 trillion in market valuation, there are clear explanations. For Bitcoin, there are several, including increased adoption and institutional acceptance as a store of value, a new currency, or as a new asset class. However, Bitcoin has no prominent value foundation other than market participants’ willingness to buy it and lots of it.
The one unassailable observation, though, is that Bitcoin is volatile, very volatile. Figure 6 shows Bitcoin’s rolling 30-day realized volatility compared to gold and a G7 currency volatility index. Often Bitcoin is compared to gold from the perspective that both are in limited supply, and both can be viewed as an alternative currency. From a volatility perspective, they are nothing alike. The five-year average of the 30-day realized volatility for Bitcoin (58.5%) is 4.4 times higher than gold bullion (13.2%) and 7.2 times higher than the G7 currency volatility index (8.1%). Though the five-year average may seem tempered, one look at the volatility chart in Figure 6, and the phrase “random walk” comes to mind.
While the claim of a limited supply of each individual cryptocurrency coin is accurate, there are no limits to the number of cryptocurrencies available. Over 8,600 known cryptocurrencies are now in circulation at last count (and growing), with a market value hitting over $1.7 trillion at the highs. For reference, the Fed states there is $2.05 trillion in Federal Reserve Notes in circulation. The limited supply or scarcity factor holds for single coins but does not hold for cryptocurrencies in aggregate. The alternative currency (or store of value) narrative is also problematic for Bitcoin, given its extreme volatility. Bitcoin was down by more than 20% in reaction to comments by Elon Musk and Janet Yellen. Generally, most prudent investors don’t like to see their other stores of value drop more than 20% in less than two days due to two people stating apparent facts, even if it may be up a phenomenal 427% year-over-year. The long-term history of assets going hyperbolic does not always end well.
Are we negative on cryptocurrencies? No, but we would like to be clear and say they are not the same as gold. Unlike a tangible asset, cryptos exist only in the digital realm and, as such, can disappear if governments, for whatever reason, choose to do so. But the speed of adoption and market value of cryptocurrencies cannot be denied. Cryptocurrencies are here to stay and will continue to evolve. The more that cryptocurrencies are adopted, the harder it will be for governments to legislate them out of existence. The data history for Bitcoin is limited relative to most other asset classes. However, besides extreme volatility, Bitcoin has so far demonstrated a relatively low correlation to most asset classes, making it viable as a diversifier in a multi-asset portfolio, depending on the allowed volatility. For most funds, that would mean a relatively small allocation. Our early analysis would indicate that Bitcoin could be a helpful addition to a precious metals allocation but not as a substitute ― take one last look at that volatility.
Figure 6. Bitcoin vs. Gold, G7 Currency: 30-Day Volatility
Source: Bloomberg. Data as of 2/28/2021.
Metals Miners: An Attractive Buying Opportunity
| 1 | Gold bullion is measured by the Bloomberg GOLDS Comdty Index. |
| 2 | Spot silver is measured by Bloomberg SILV Comdty Index. |
| 3 | The Solactive Gold Miners Custom Factors Index (Index Ticker: SOLGMCFT) aims to track the performance of larger-sized gold mining companies whose stocks are listed on Canadian and major U.S. exchanges. |
| 4 | VanEck Vectors® Gold Miners ETF (GDX®) seeks to replicate as closely as possible, before fees and expenses, the price and yield performance of the NYSE Arca Gold Miners Index (GDMNTR), which is intended to track the overall performance of companies involved in the gold mining industry. The SPDR Gold Shares ETF (GLD) is one of the largest gold ETFs. |
| 5 | The U.S. Dollar Index (USDX, DXY, DX) is an index (or measure) of the value of the United States dollar relative to a basket of foreign currencies, often referred to as a basket of U.S. trade partners’ currencies. |
| 6 | The S&P 500 or Standard & Poor’s 500 Index is a market-capitalization-weighted index of the 500 largest U.S. publicly traded companies. (TR indicates total return and reflects the reinvestment of any dividends). |
| 7 | The 10-year breakeven rate measures the difference or gap between 10 year Treasury Bonds and Treasury Inflation Protected Securities (TIPS). Source: Investopedia. |
| 8 | “Taper tantrum” refers to the 2013 collective reactionary panic that triggered a spike in U.S. Treasury yields after investors learned that the Federal Reserve was slowly putting the breaks on its quantitative easing (QE) program. Source: Investopedia. |
| 9 | A Eurodollar bundle consists of the simultaneous sale or purchase of one each of a series of consecutive Eurodollar futures contracts. Eurodollars are sometimes color-coded to facilitate reference to individual contract months or to packs and bundles, such as three-year Eurodollar futures (greens). |
| 10 | Commodity Trading Advisors (CTAs) are quant funds or investment funds that select securities using advanced quantitative analysis. |
| 11 | The price-to-earnings ratio (P/E ratio) compares a company’s share price to the earnings it generates per share. A variation on this calculation is known as the forward P/E. Investors or analysts may use projected earnings per share, meaning the earnings expected to be generated per share over the next 12 months. |
| 12 | R-squared values are commonly stated as percentages from 0% to 100%. An R-squared of 100% means that all movements of a security (or another dependent variable) are completely explained by movements in the index, or the independent variable(s) you are interested in. Source Investopedia. |
| 13 | M2 is a measure of the money supply that includes cash, checking deposits and easily convertible near money. M2 is a broader measure of the money supply than M1, including cash and checking deposits. Source: Investopedia. |
| 14 | The 2s10s spread is one of the most-watched economic indicators, and it simply represents the difference between the 10-year and the 2-year U.S. Treasury yields. |
| 15 | The MOVE Index calculates the future volatility in U.S. Treasury yields implied by current prices of options on Treasuries of various maturities. |
| 16 | The Volatility Index, or VIX, is a real-time market index representing the market’s expectation of 30-day forward-looking volatility. Derived from the price inputs of the S&P 500 index options, it provides a measure of market risk and investors’ sentiments. |
| 17 | The relative strength index (RSI) is a momentum indicator used in technical analysis that measures the magnitude of recent price changes to evaluate overbought or oversold conditions in the price of a stock or other asset |
| 18 | Value at Risk (VaR) calculates the maximum loss expected (or worst case scenario) on an investment over a given time period and given a specified degree of confidence. |
| 19 | Spot platinum is measured by Bloomberg PLAT Comdty Index |
Important Disclosure
Past performance is no guarantee of future results. You cannot invest directly in an index. Investments, commentary and statements are unique and may not be reflective of investments and commentary in other strategies managed by Sprott Asset Management USA, Inc., Sprott Asset Management LP, Sprott Inc., or any other Sprott entity or affiliate. Opinions expressed in this commentary are those of the presenter and may vary widely from opinions of other Sprott affiliated Portfolio Managers or investment professionals.
This content may not be reproduced in any form, or referred to in any other publication, without acknowledgment that it was produced by Sprott Asset Management LP and a reference to sprott.com. The opinions, estimates and projections (“information”) contained within this content are solely those of Sprott Asset Management LP (“SAM LP”) and are subject to change without notice. SAM LP makes every effort to ensure that the information has been derived from sources believed to be reliable and accurate. However, SAM LP assumes no responsibility for any losses or damages, whether direct or indirect, which arise out of the use of this information. SAM LP is not under any obligation to update or keep current the information contained herein. The information should not be regarded by recipients as a substitute for the exercise of their own judgment. Please contact your own personal advisor on your particular circumstances. Views expressed regarding a particular company, security, industry or market sector should not be considered an indication of trading intent of any investment funds managed by Sprott Asset Management LP. These views are not to be considered as investment advice nor should they be considered a recommendation to buy or sell. SAM LP and/or its affiliates may collectively beneficially own/control 1% or more of any class of the equity securities of the issuers mentioned in this report. SAM LP and/or its affiliates may hold short position in any class of the equity securities of the issuers mentioned in this report. During the preceding 12 months, SAM LP and/or its affiliates may have received remuneration other than normal course investment advisory or trade execution services from the issuers mentioned in this report.
SAM LP is the investment manager to the Sprott Physical Bullion Trusts (the “Trusts”). Important information about the Trusts, including the investment objectives and strategies, purchase options, applicable management fees, and expenses, is contained in the prospectus. Please read the document carefully before investing. Investment funds are not guaranteed, their values change frequently and past performance may not be repeated. This communication does not constitute an offer to sell or solicitation to purchase securities of the Trusts.
The risks associated with investing in a Trust depend on the securities and assets in which the Trust invests, based upon the Trust’s particular objectives. There is no assurance that any Trust will achieve its investment objective, and its net asset value, yield and investment return will fluctuate from time to time with market conditions. There is no guarantee that the full amount of your original investment in a Trust will be returned to you. The Trusts are not insured by the Canada Deposit Insurance Corporation or any other government deposit insurer. Please read a Trust’s prospectus before investing.
The information contained herein does not constitute an offer or solicitation to anyone in the United States or in any other jurisdiction in which such an offer or solicitation is not authorized or to any person to whom it is unlawful to make such an offer or solicitation. Prospective investors who are not resident in Canada or the United States should contact their financial advisor to determine whether securities of the Funds may be lawfully sold in their jurisdiction.
The information provided is general in nature and is provided with the understanding that it may not be relied upon as, nor considered to be, the rendering or tax, legal, accounting or professional advice. Readers should consult with their own accountants and/or lawyers for advice on the specific circumstances before taking any action.
© 2021 Sprott Inc. All rights reserved.
