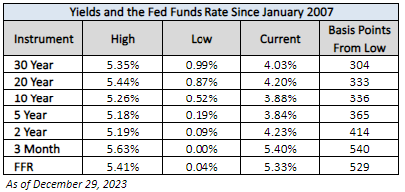
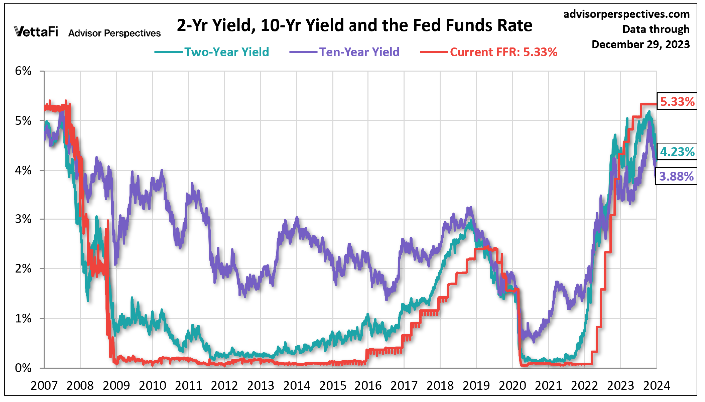
The yield on the 10-year note ended December 29, 2023 at 3.88%, the 2-year note ended at 4.23%, and the 30-year at 4.03%.
Here is a table showing the yields’ highs and lows and the FFR since 2007.
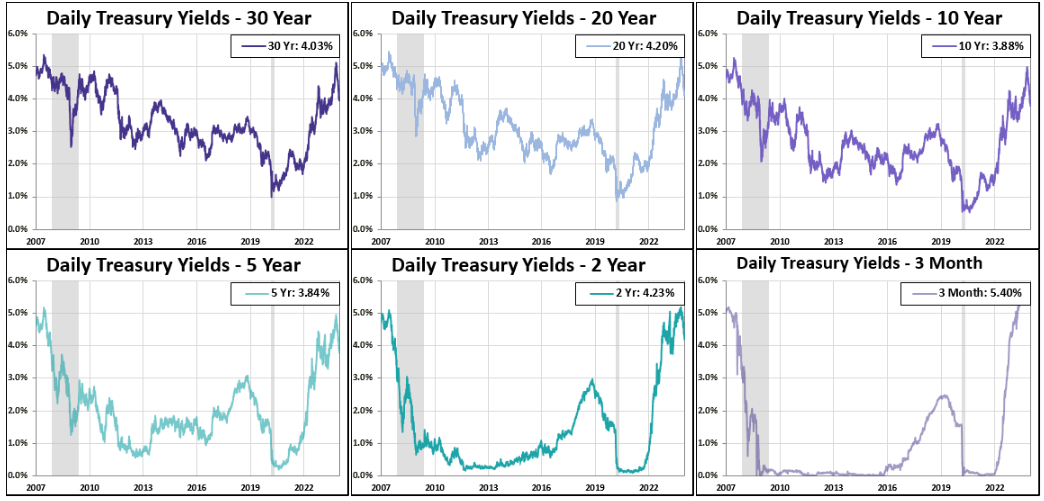
The charts below show the daily performance of several Treasury bonds since the pre-recession days of equity market peaks in 2007.
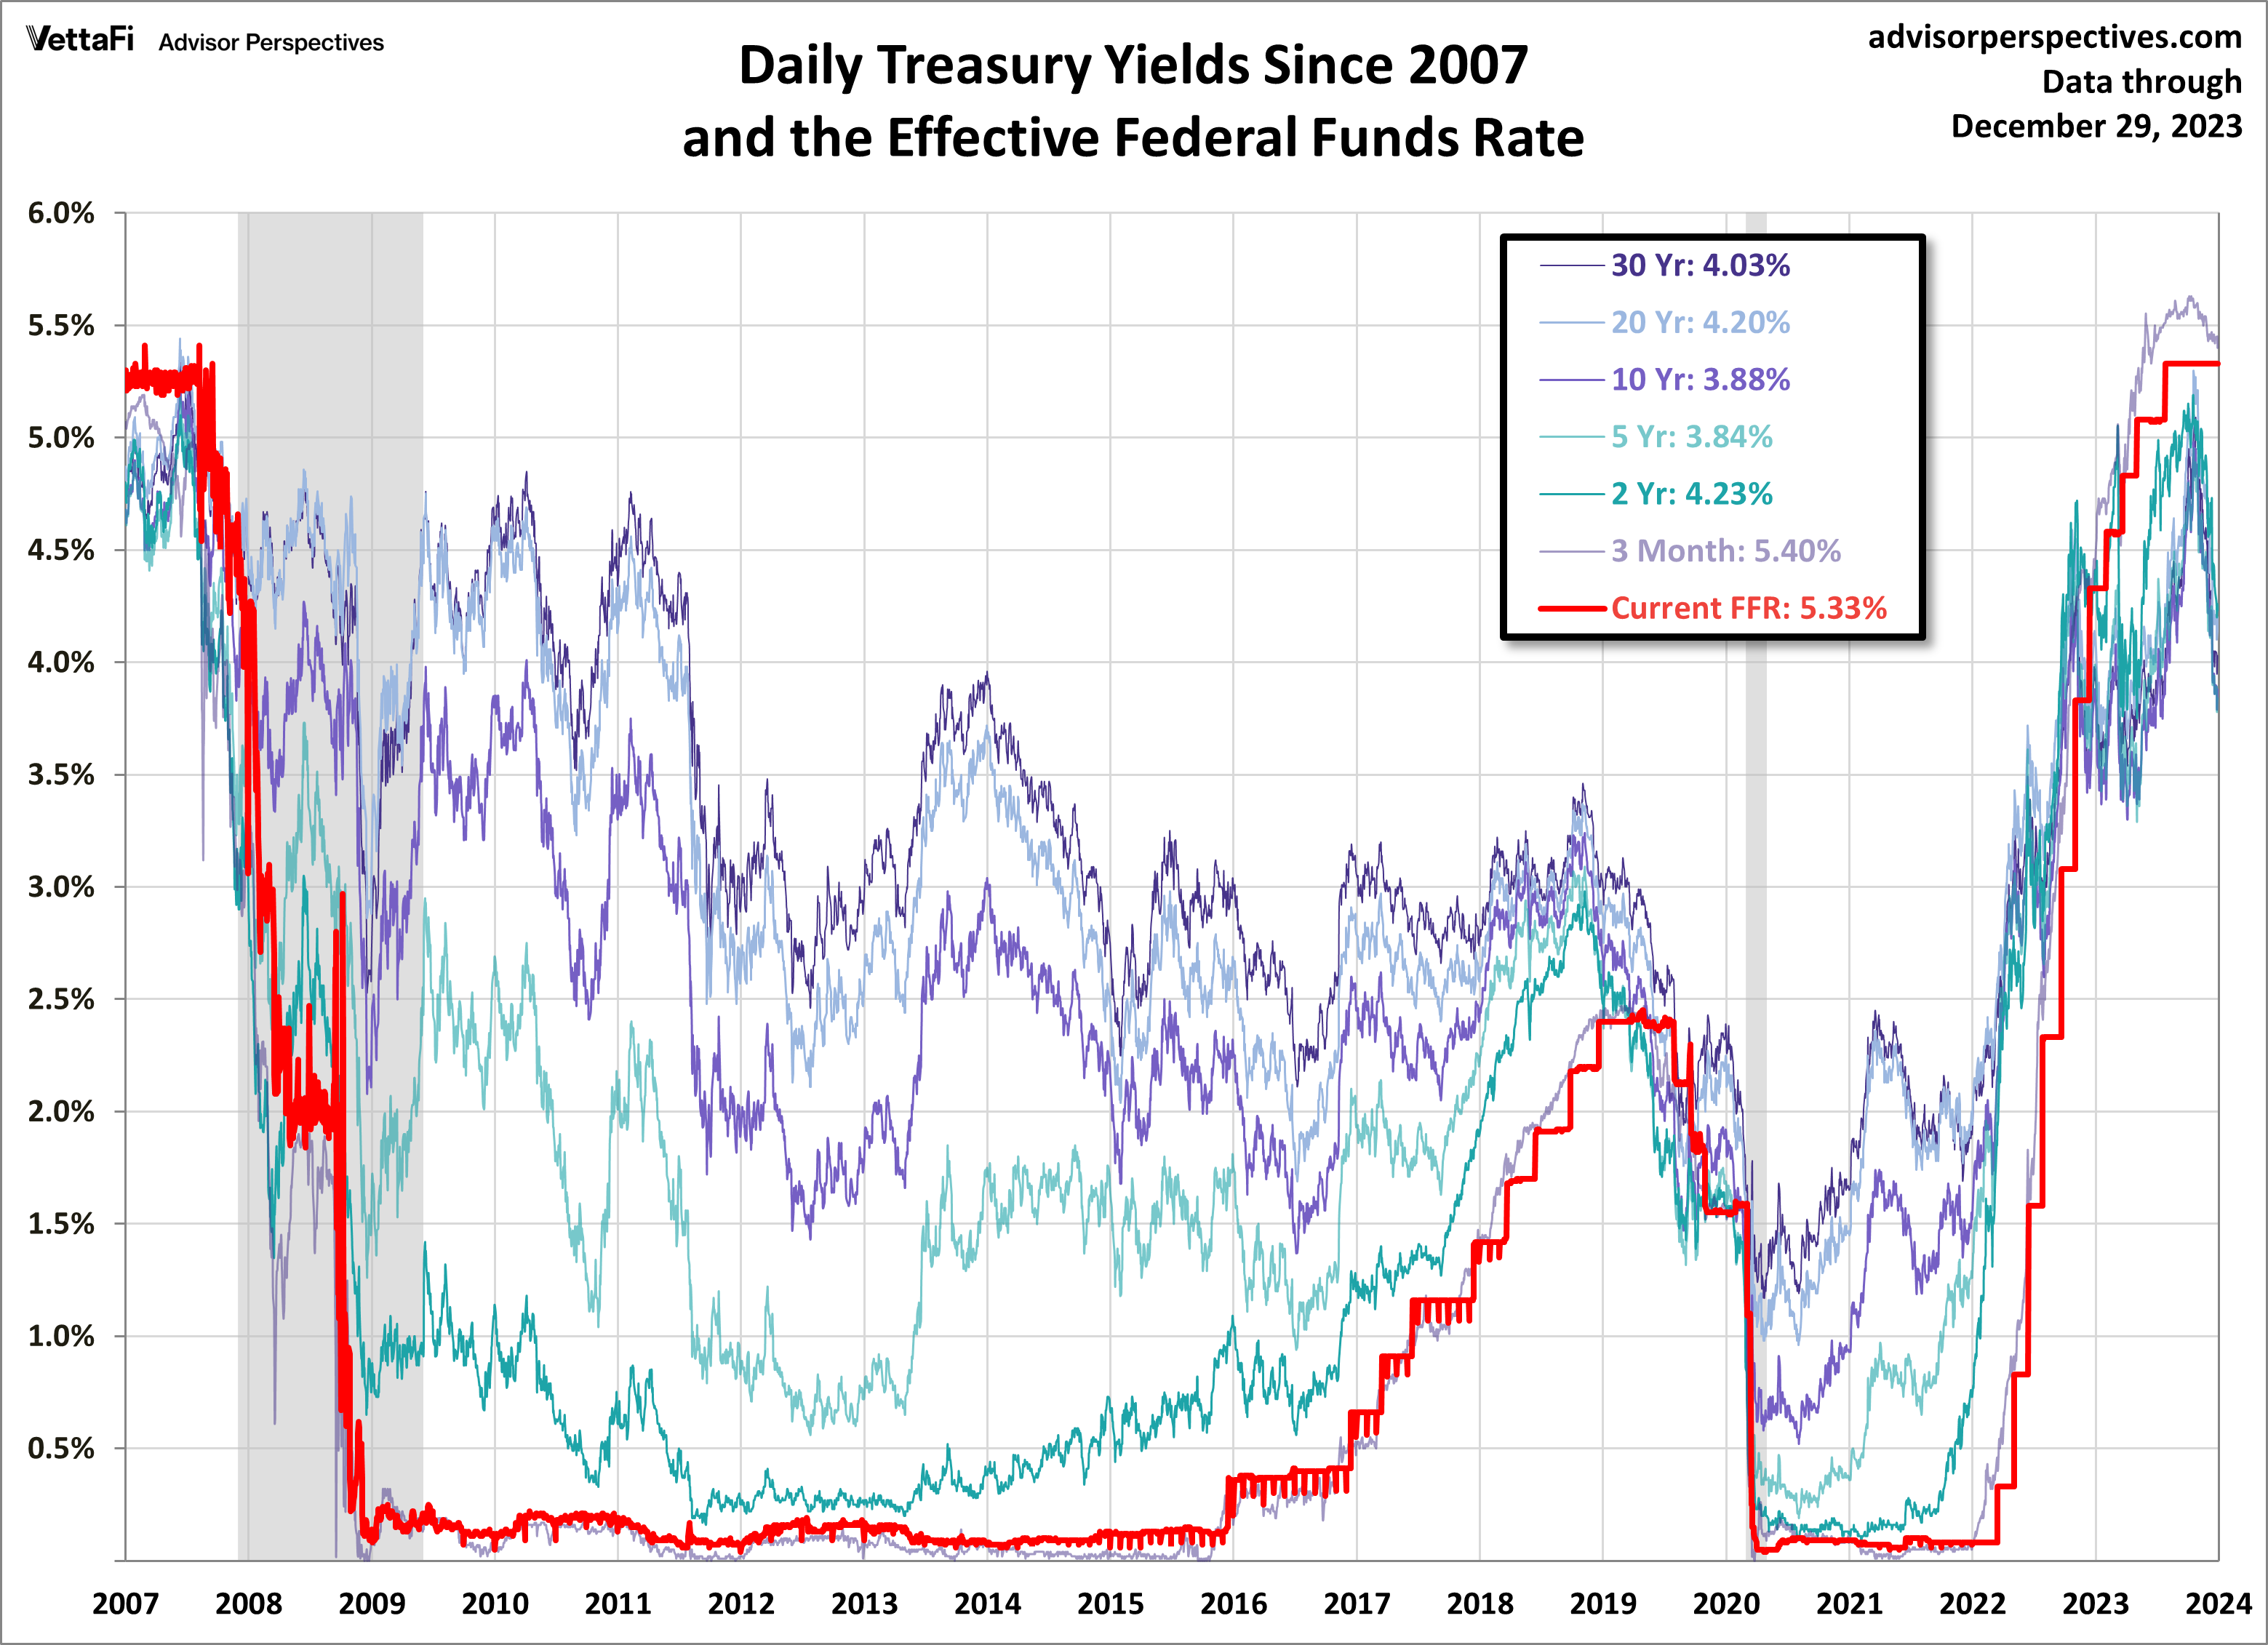
The next chart is an overlay of all 6 charts above along with the Fed funds rate (FFR) since 2007.
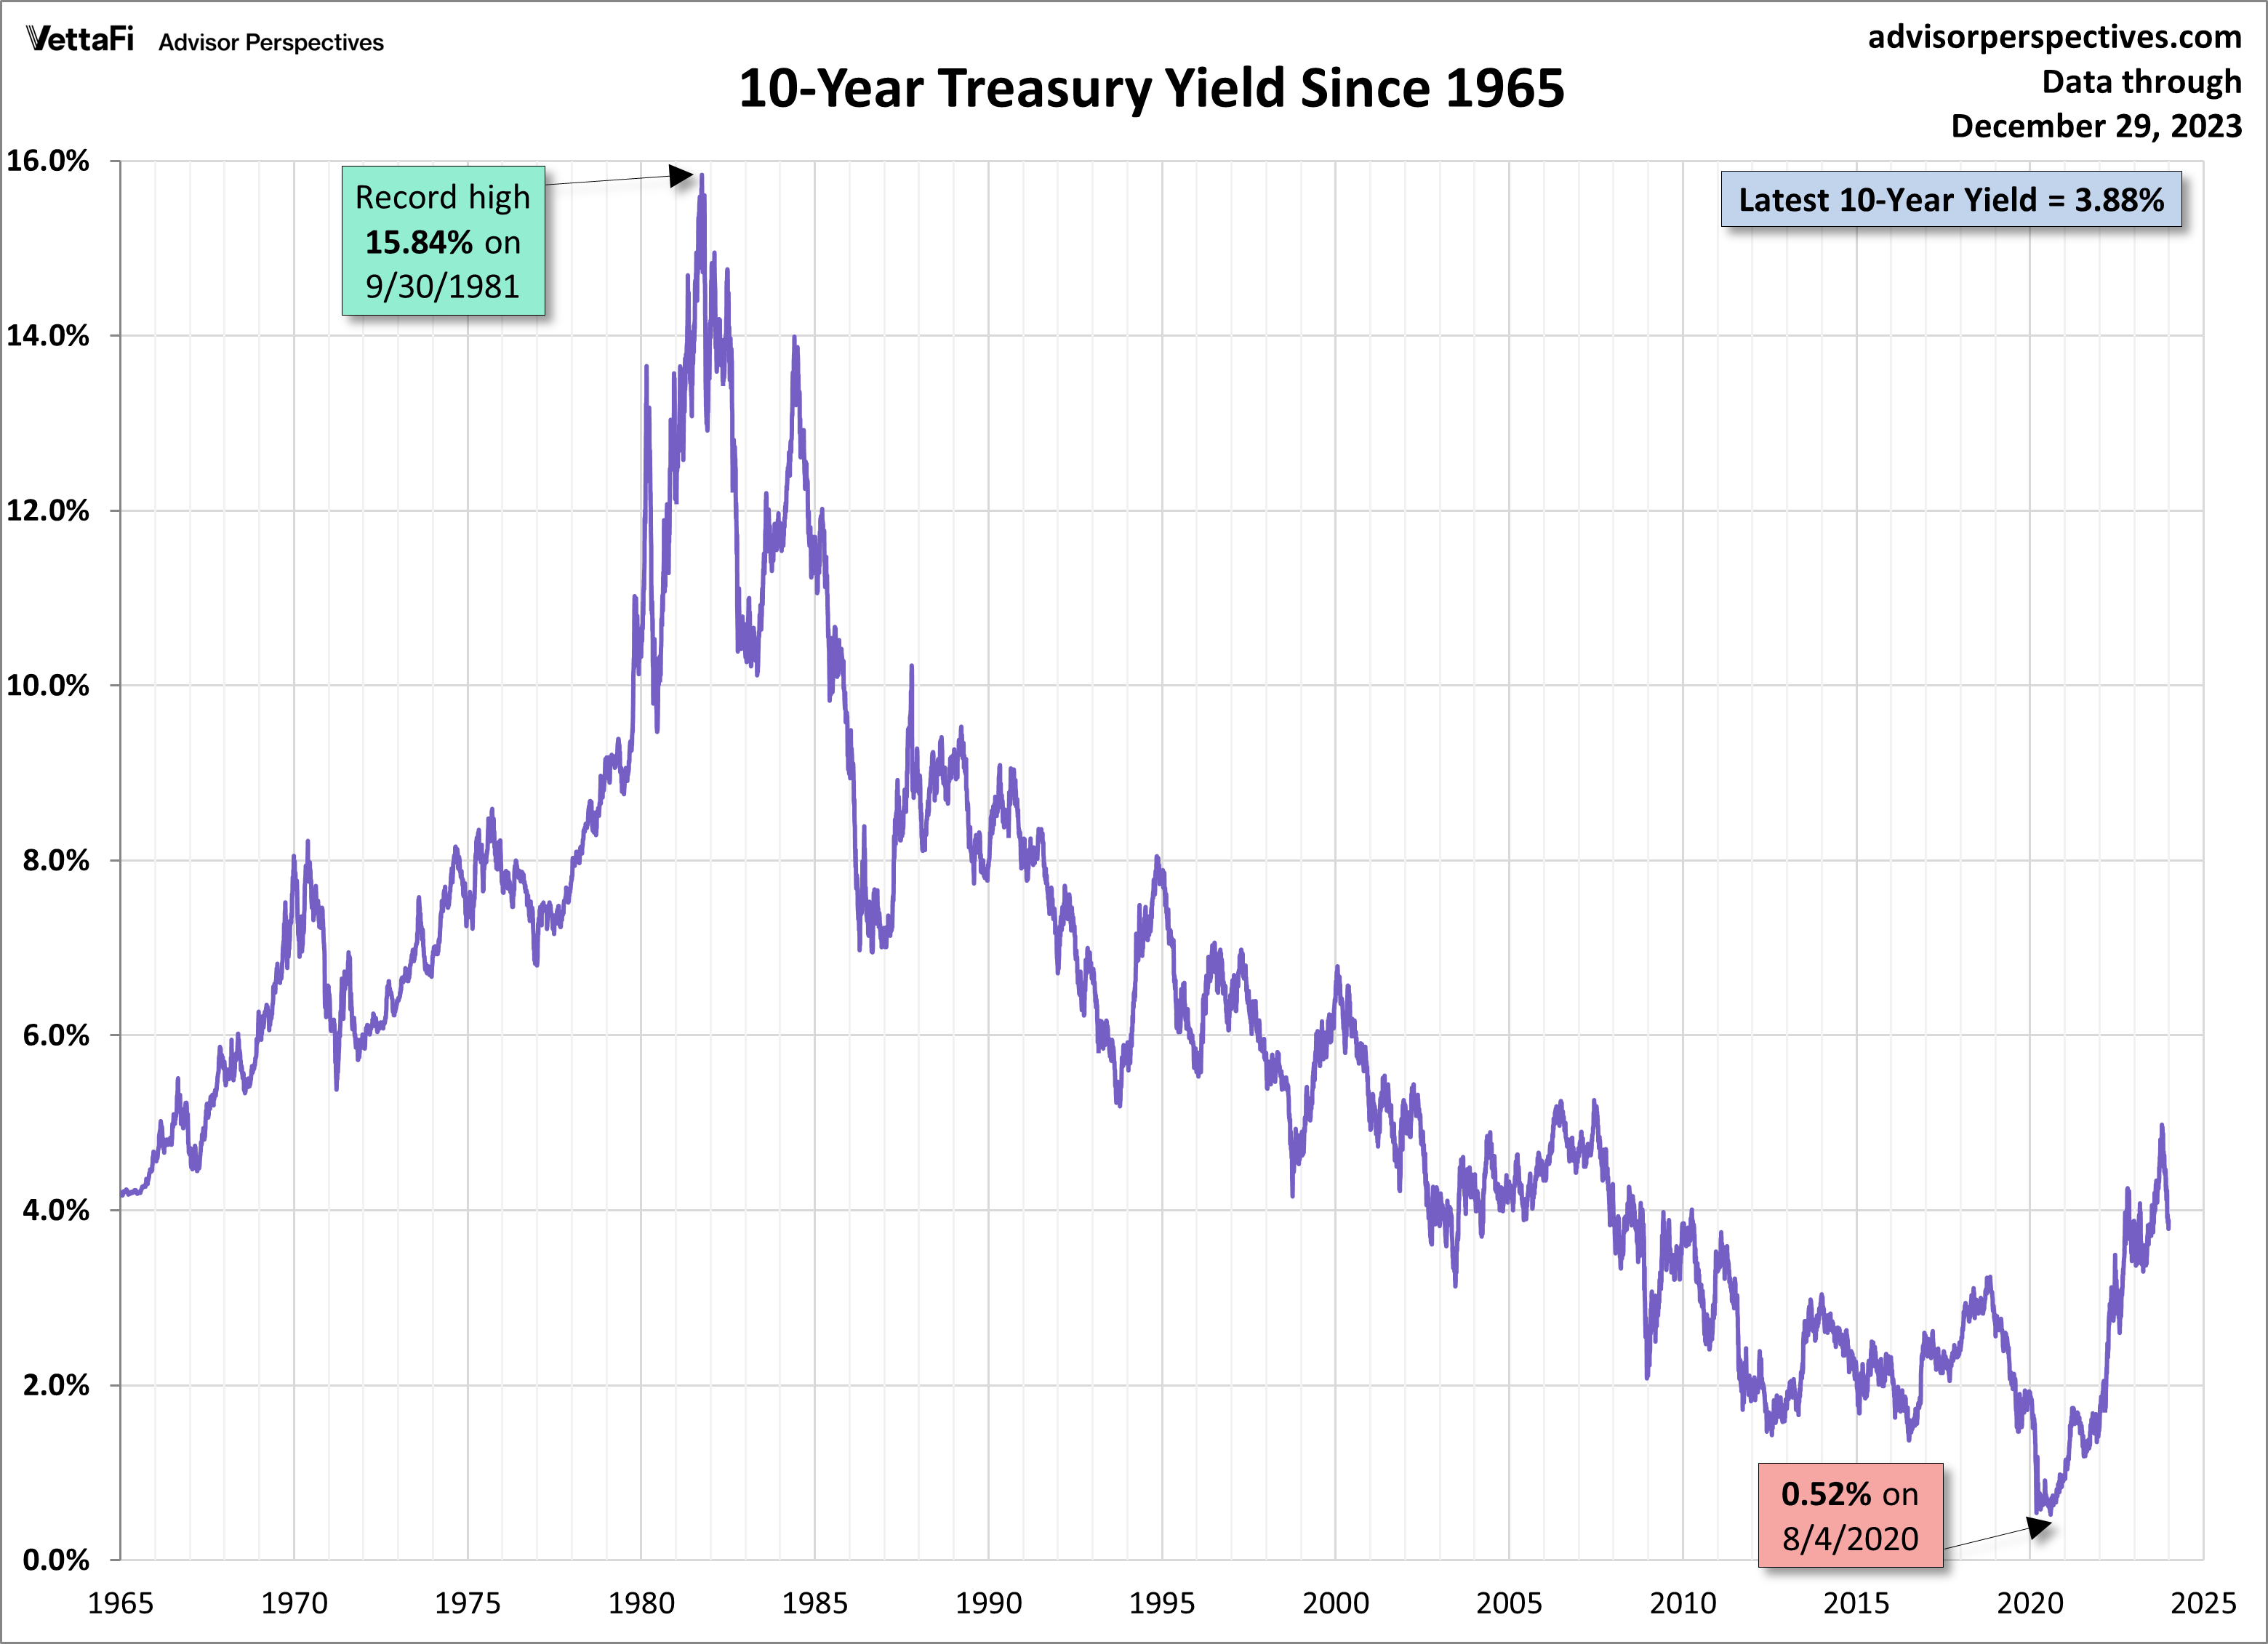
A Long-Term Look at the 10-Year Treasury Yield
Here is a long look of the 10-year yield with a start date of 1965, well before the 1973 oil embargo that triggered the era of “stagflation” (economic stagnation with inflation).
Yield Curve
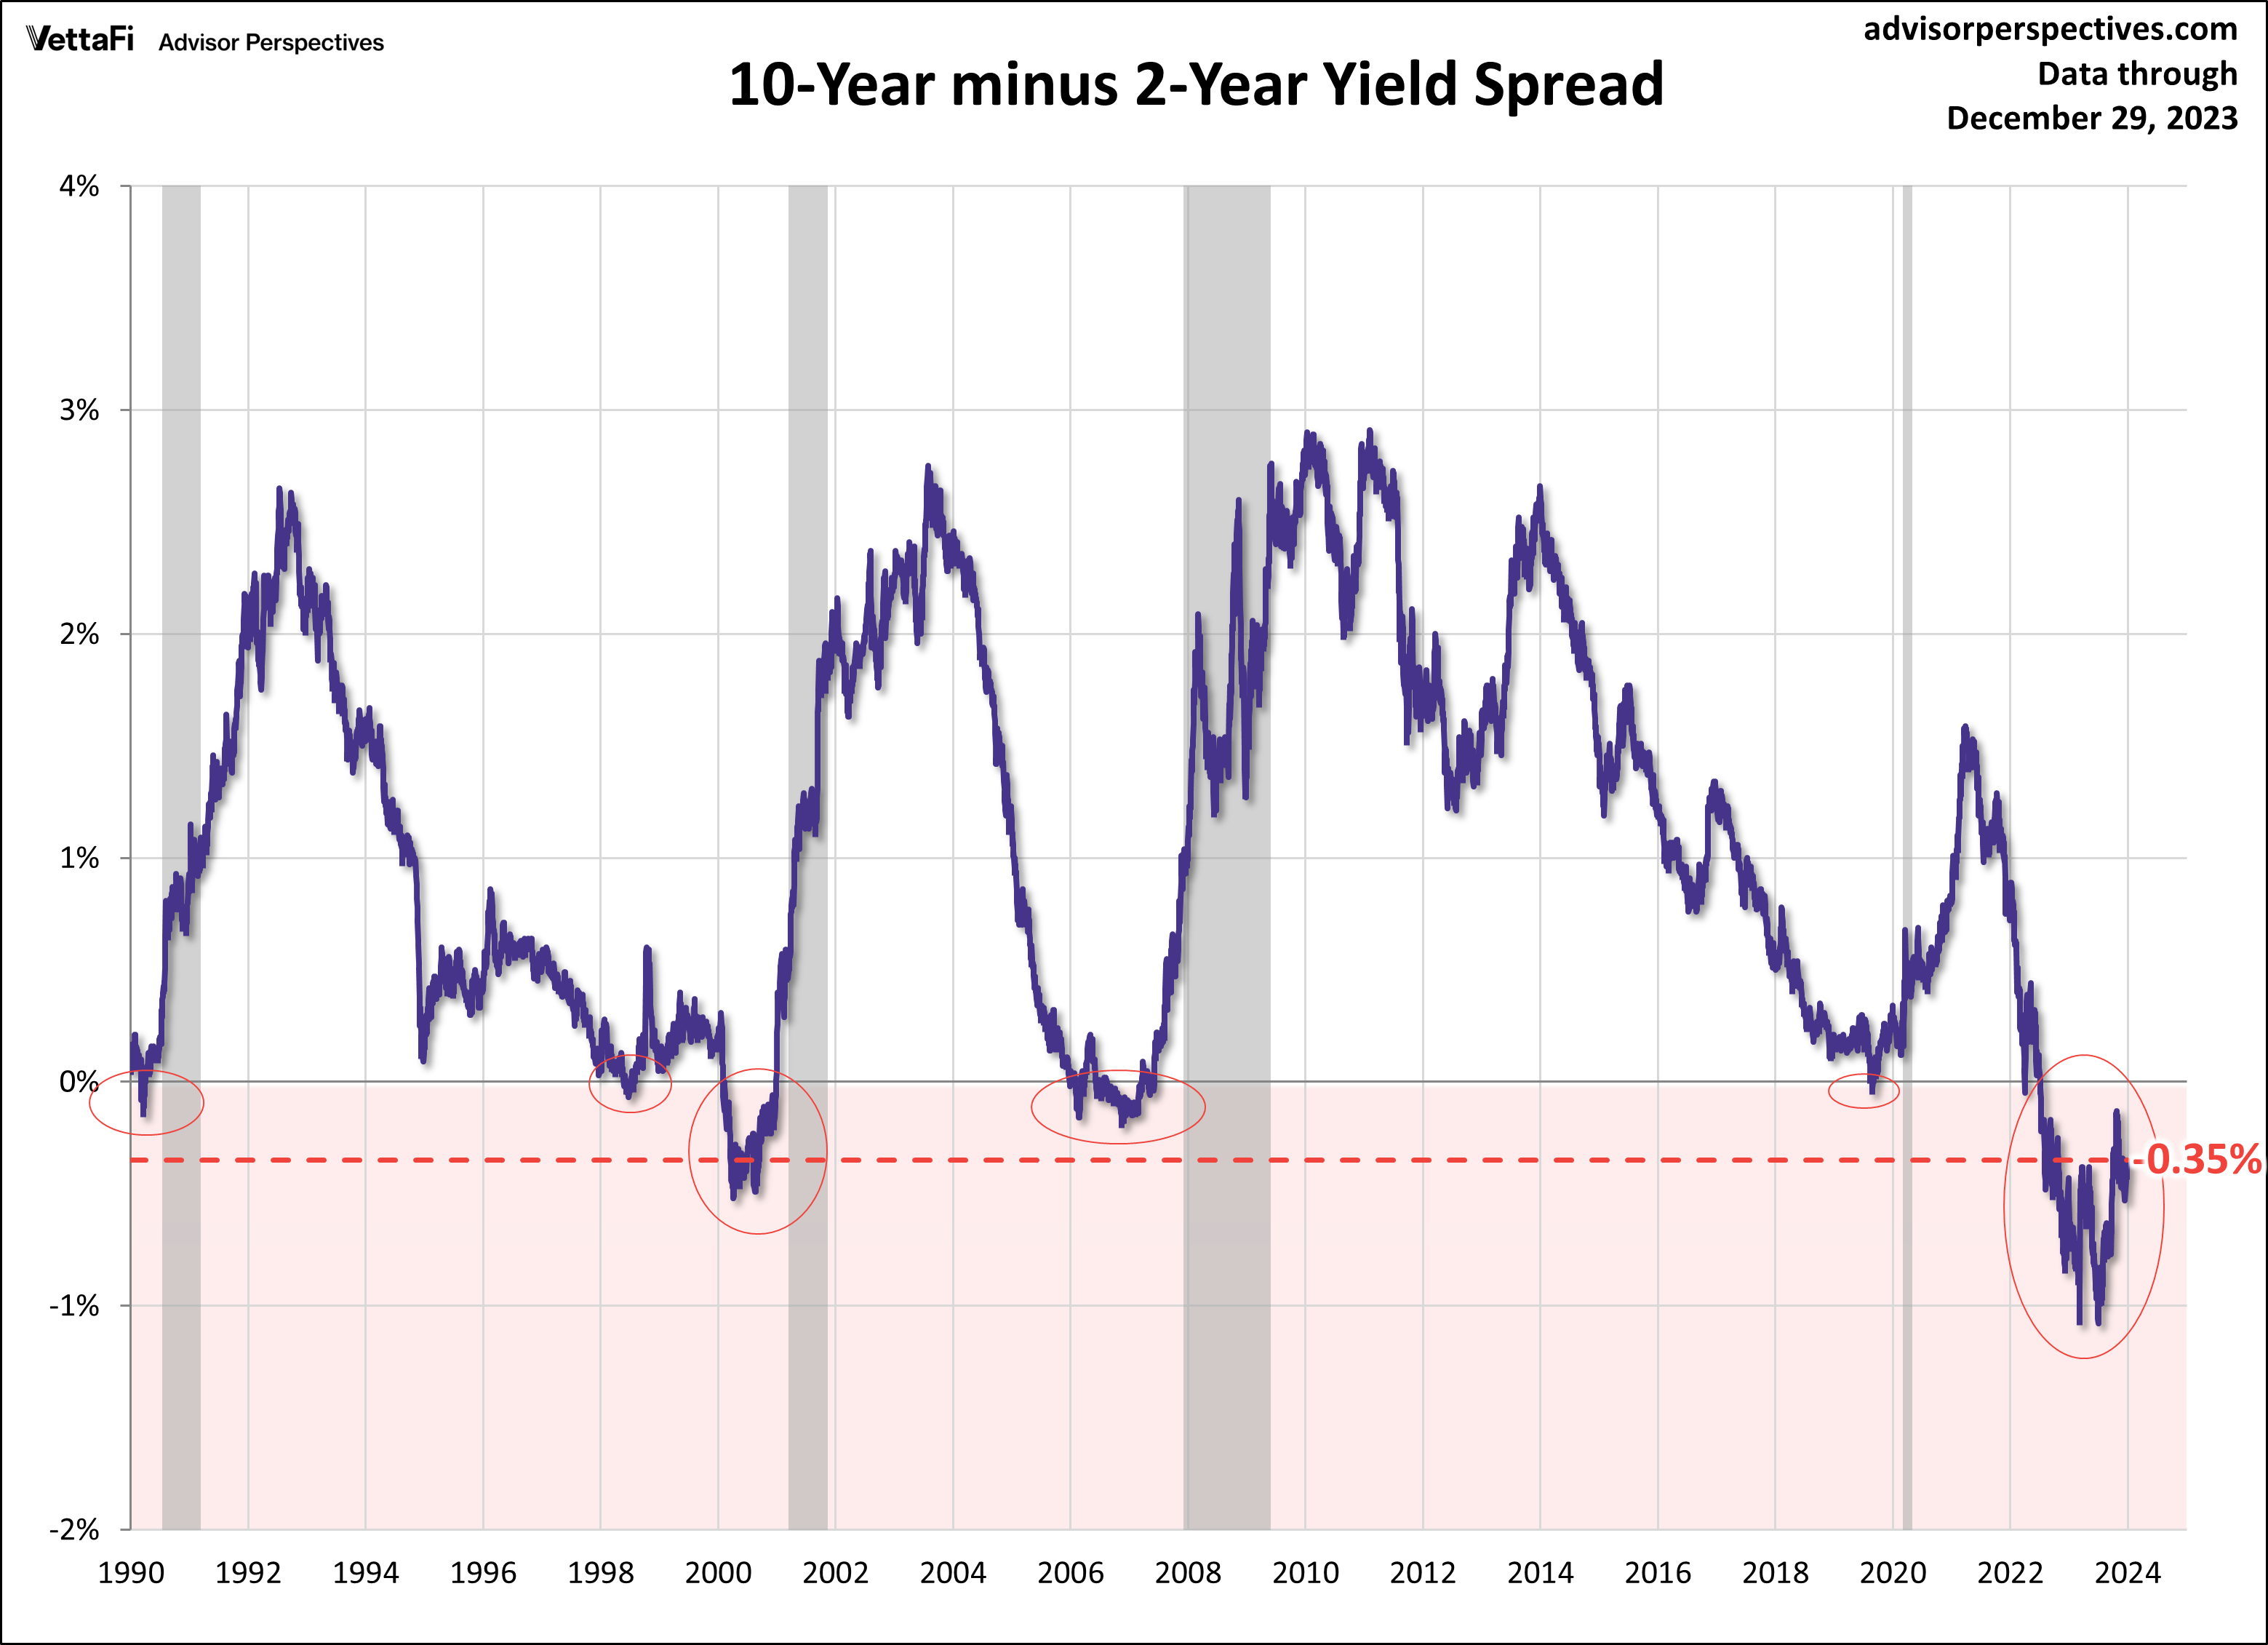
Here’s the latest 10-2 spread. Typically, the spread goes negative for a period and then out of the red prior to recessions, and is thus considered a reliable leading indicator for recessions. The lead time for recessions is quite a range – after going negative, recessions have begun anywhere from 16 to 62 weeks later. We also can see a false positive in 1998 where the spread went negative for a short period. For the 2009 recession, the spread went negative a couple of different times before rising.
If we use the first negative spread date as our starting point, the average number of weeks leading up to a recession is 37, or about nine months. If we use the last positive spread date after being negative before a recession, the average is 17 weeks, or 4.25 months and the median is 14 weeks, or 3.5 months.
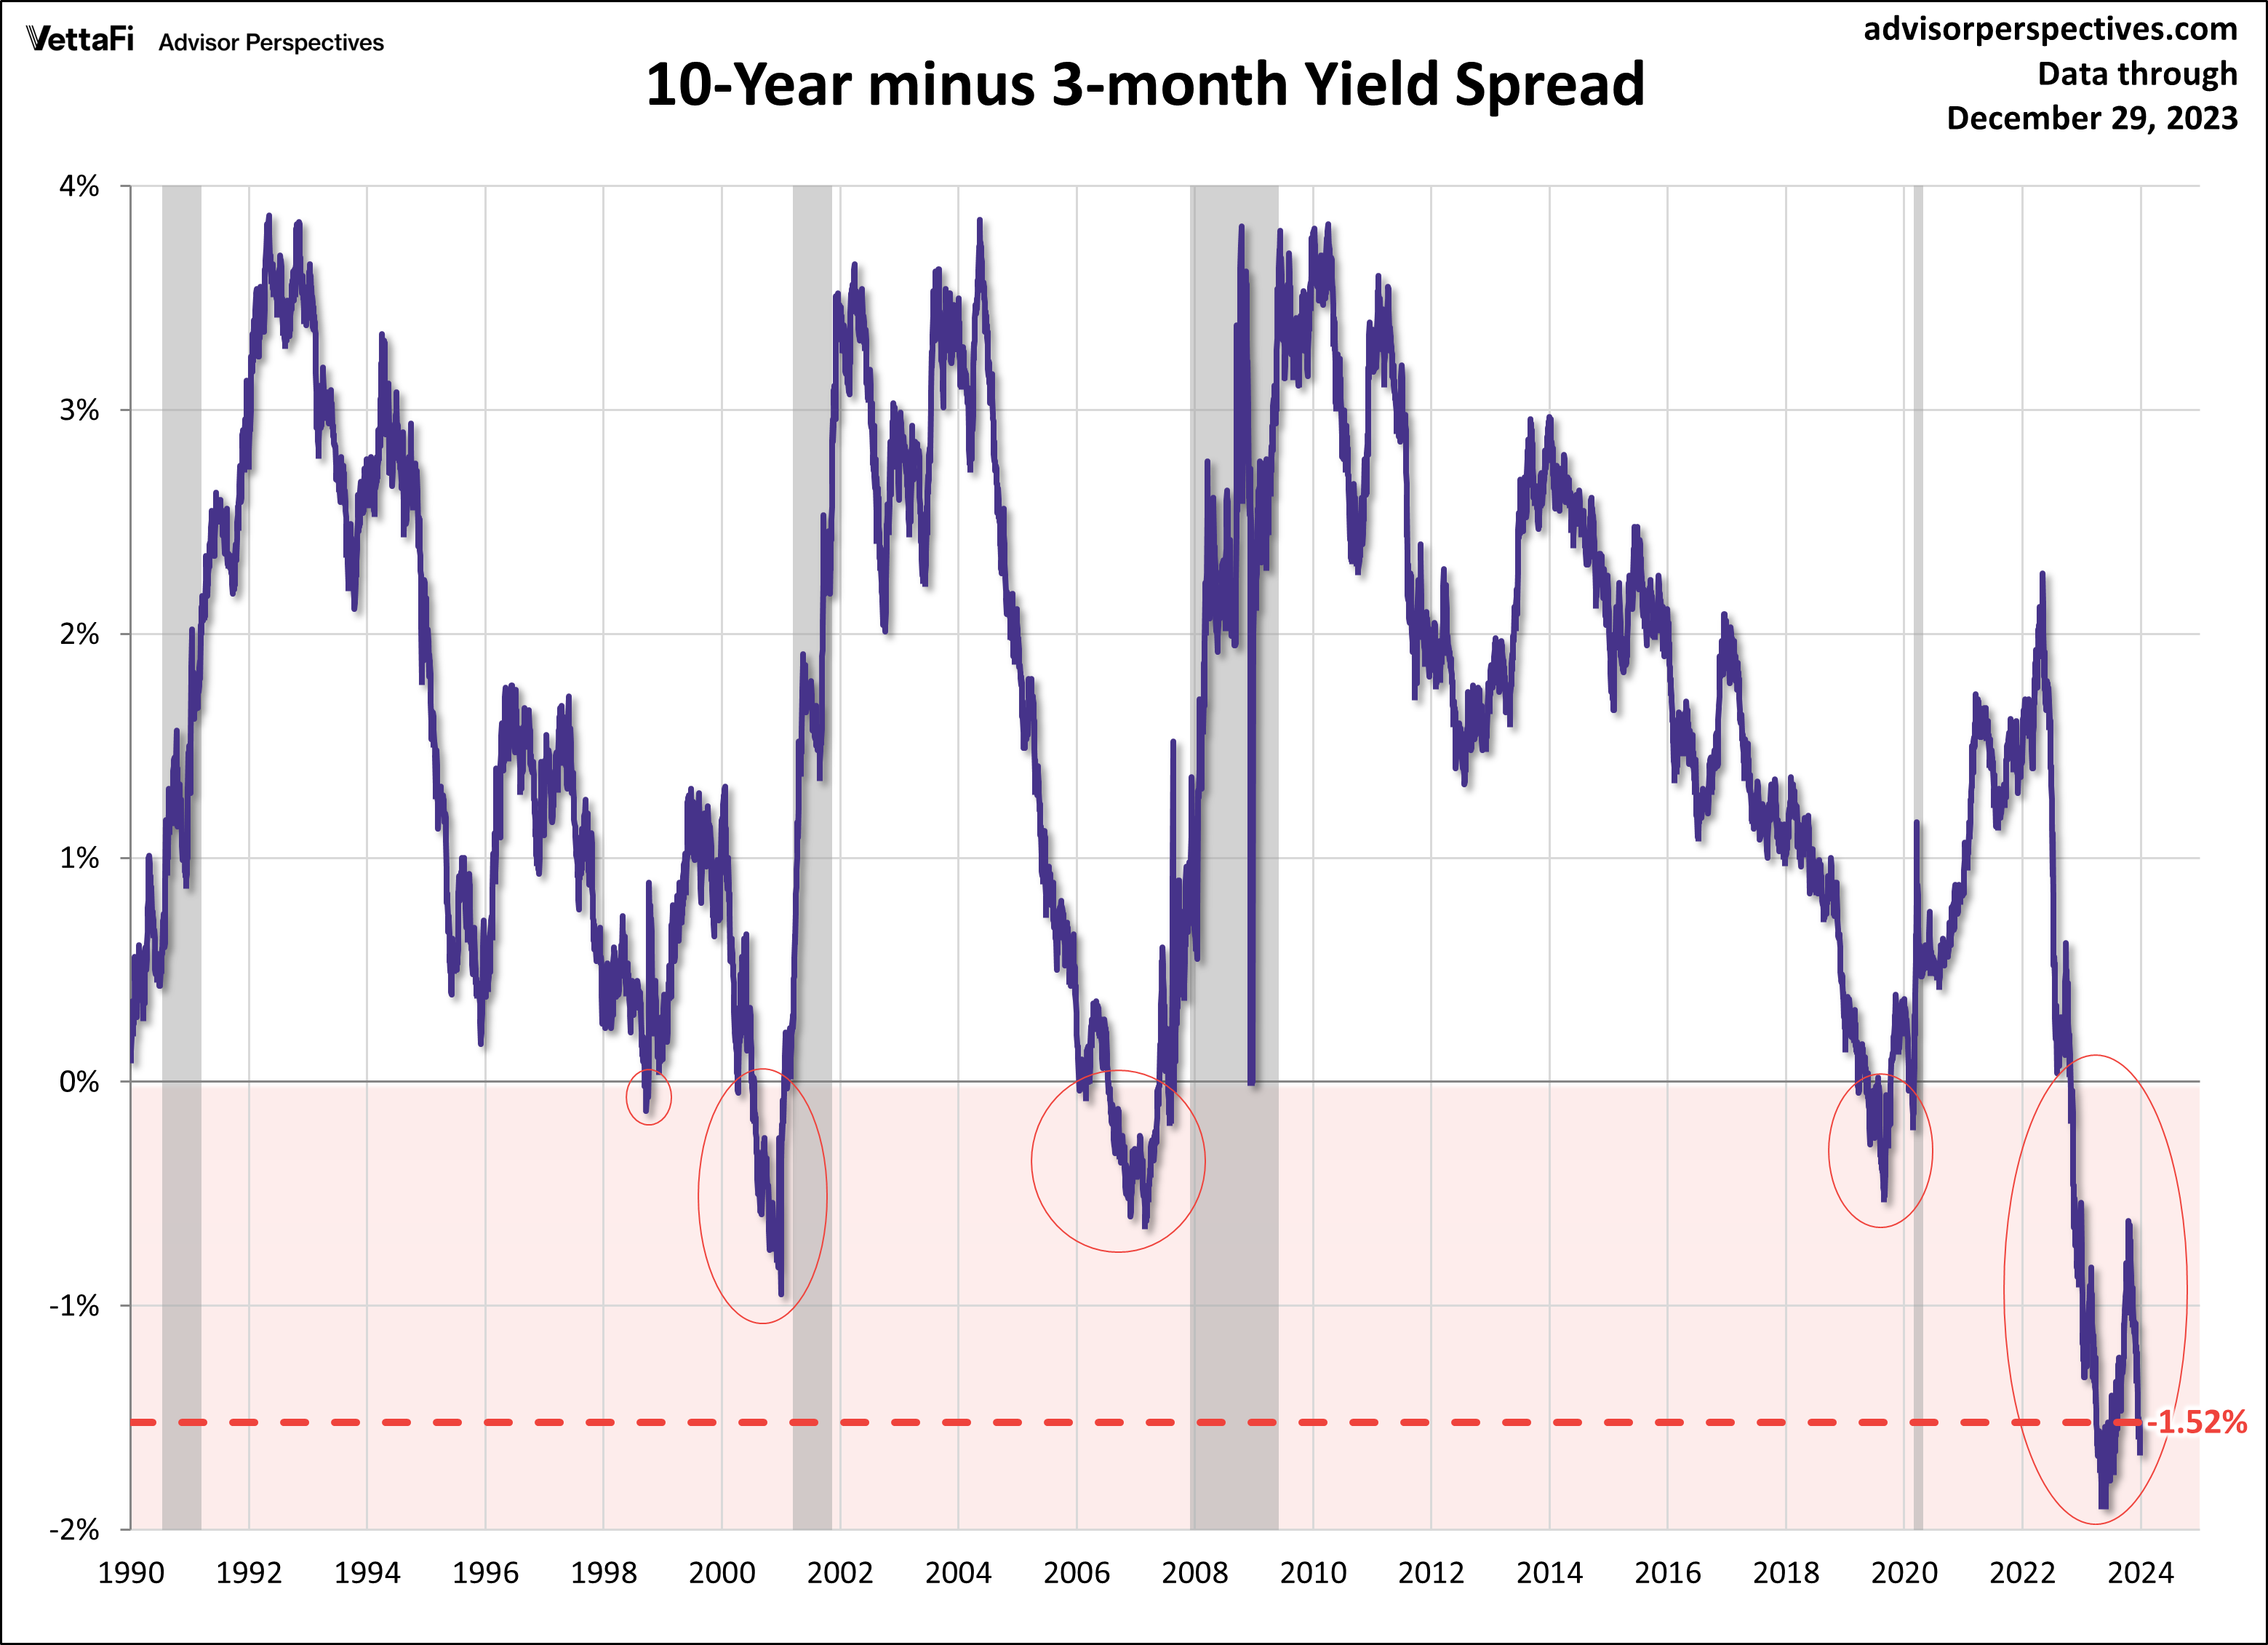
For another perspective on the yield curve, the 10-3mo spread below utilizes an even shorter-term maturity.
The 30-Year Fixed Rate Mortgage
The latest Freddie Mac Weekly Primary Mortgage Market Survey put the 30-year fixed rate at 6.61%. Here is a long look back, courtesy of a FRED graph, of the 30-year fixed-rate mortgage average, which began in April of 1971.
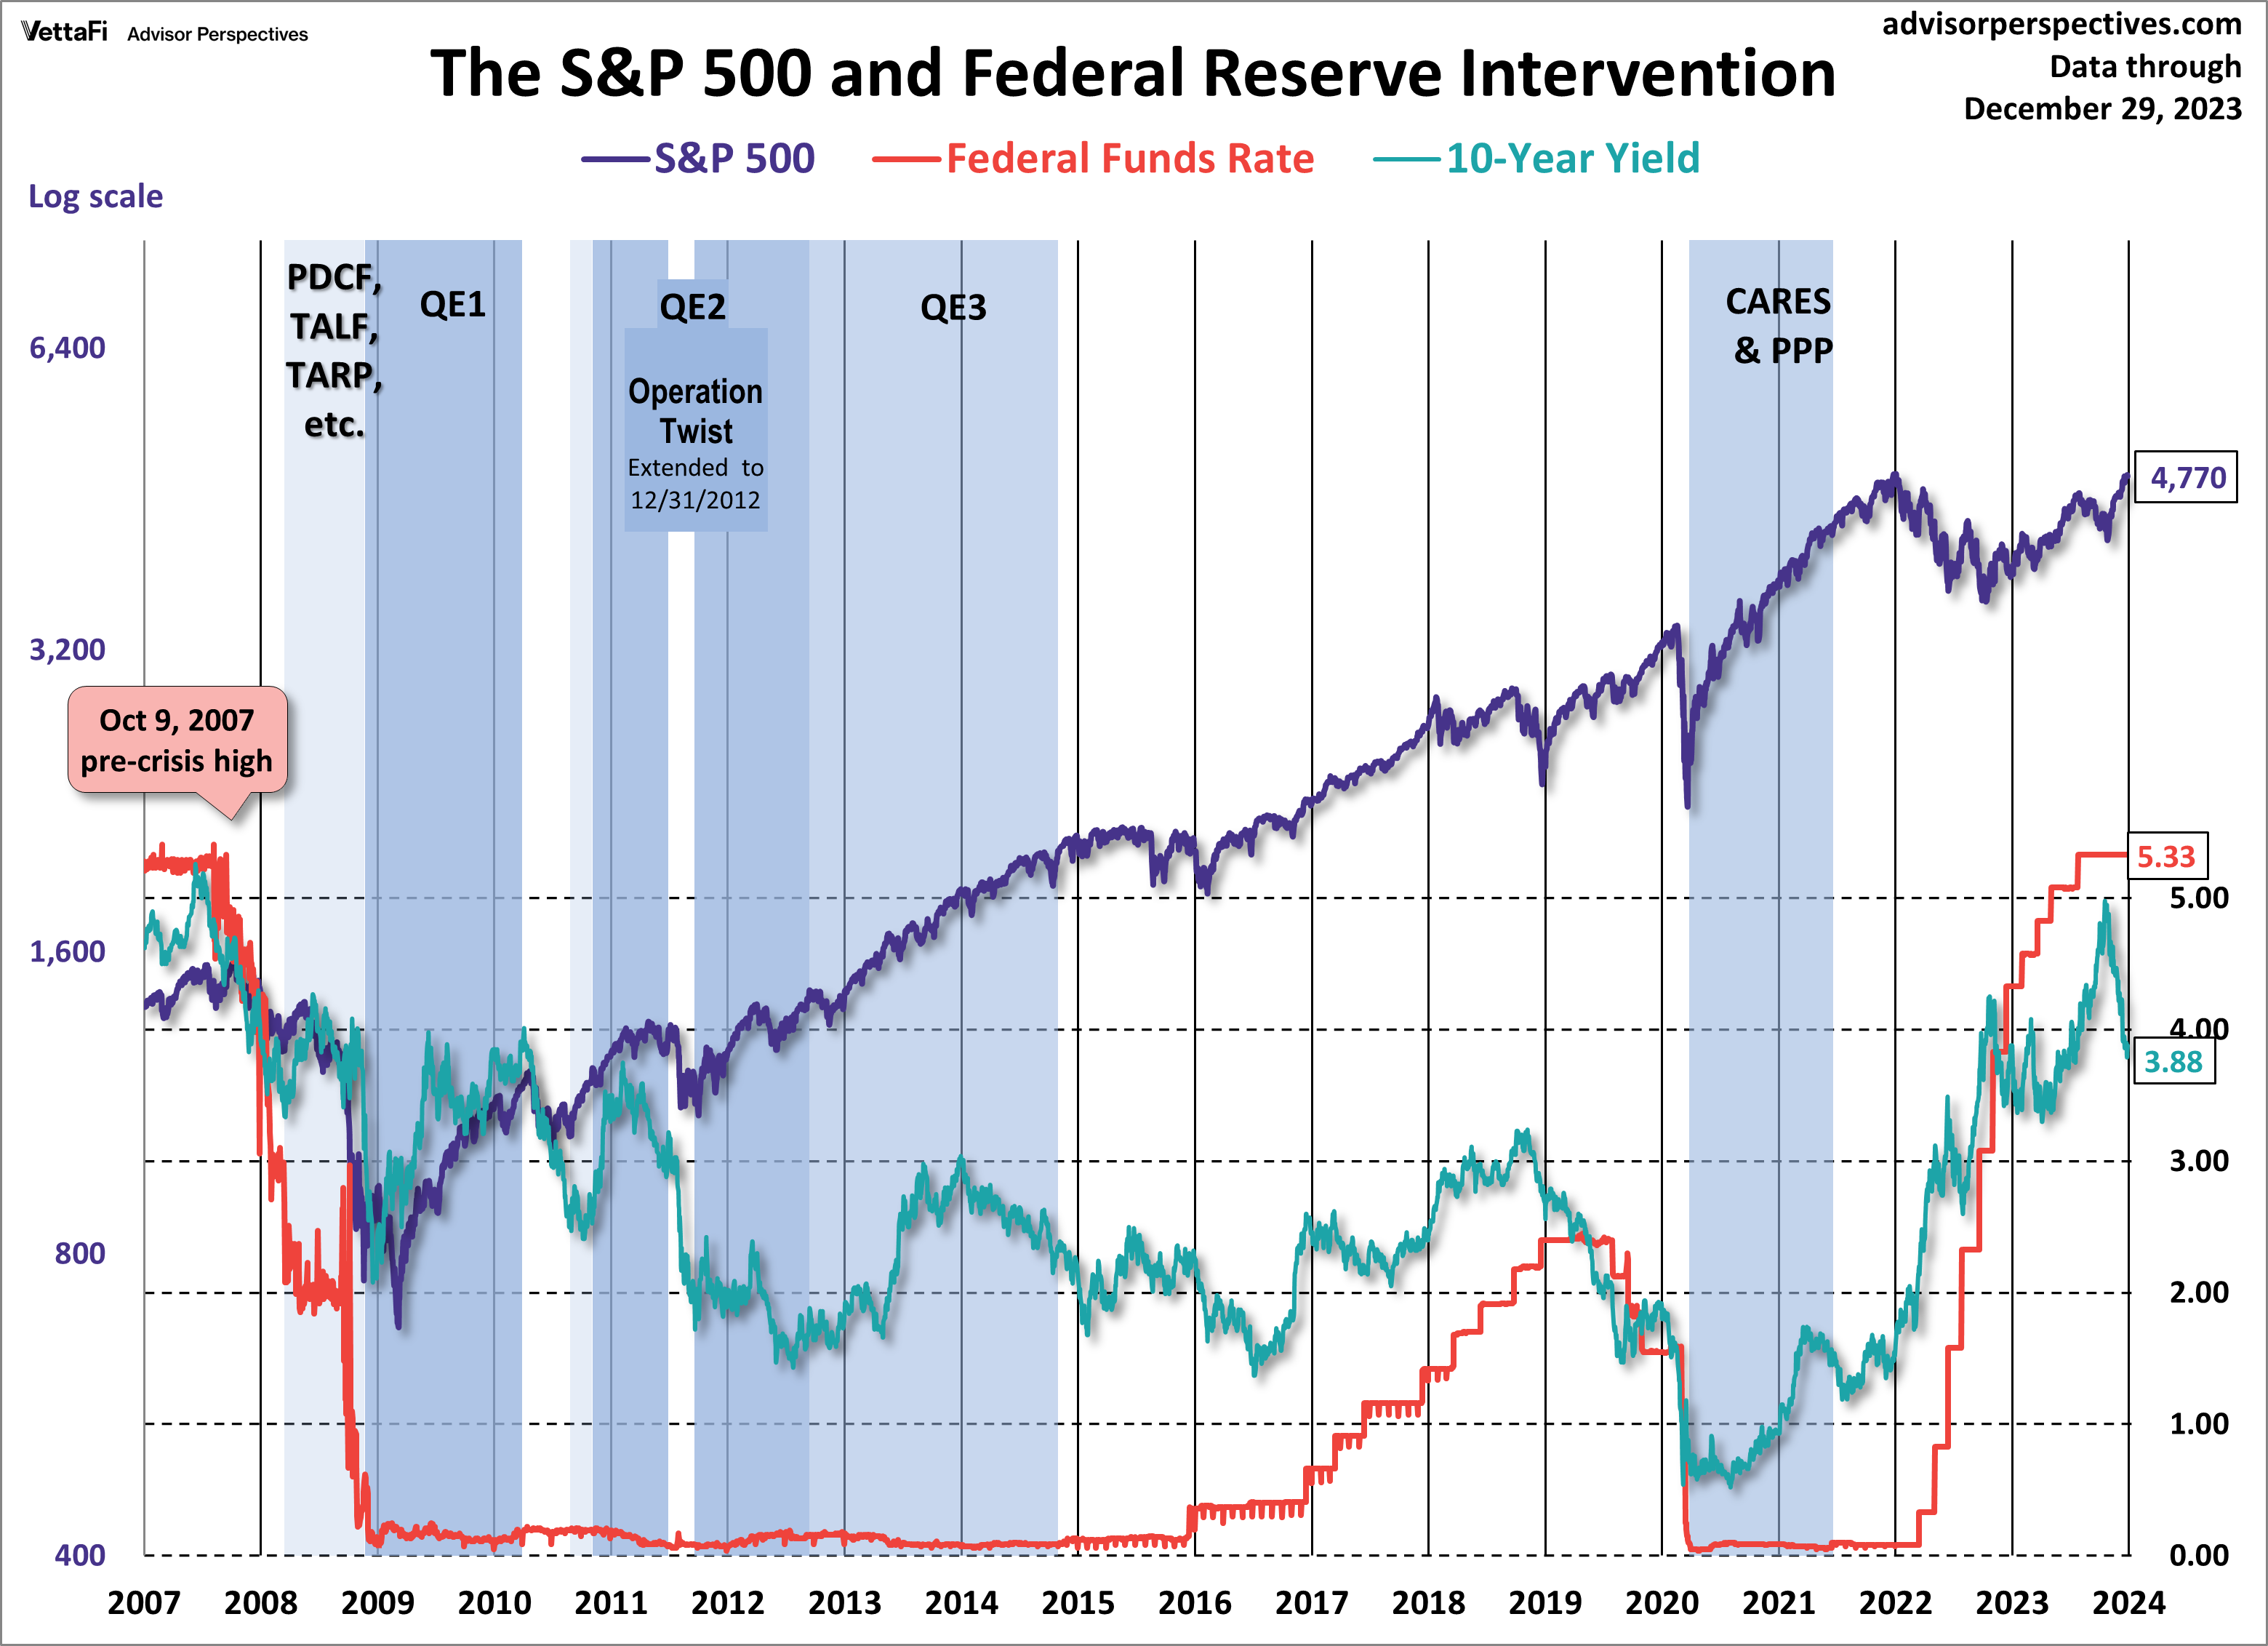
Now let’s see the 10-year against the S&P 500 with some notes on Federal Reserve intervention. Fed policy has been a major influence on market behavior.
For a long-term view of weekly Treasury yields, also focusing on the 10-year, see our latest Treasury Yields in Perspective update.
ETFs associated with Treasuries include: iShares 1-3 Year Treasury Bond ETF (SHY), iShares 7-10 Year Treasury Bond ETF (IEF), and iShares 20+ Year Treasury Bond ETF (TLT).
Originally published on Advisor Perspectives.
For more news, information, and analysis, visit the Fixed Income Channel.
