
By Todd Rosenbluth, CFRA
Key Takeaways
- Actively managed municipal bond ETFs gathered $1.1 billion of new money year-to-date through July 24, equal to 18% share of the tax-free ETF category. This is much larger than its 7% share of the asset base.
- First Trust Managed Municipal ETF (FMB) is the largest and most popular of these ETFs, but PIMCO Intermediate Municipal Bond ETF (MUNI) and IQ Mackay Shields Municipal Insured ETF (MMIN) have grown in 2020 from increased interest.
- Some of the more popular active municipal bond ETFs are available for less than half the expense ratio as similar mutual fund alternatives, creating an opportunity as investors further appreciate the benefits of ETFs.

Fundamental Context
Actively managed municipal bond ETFs have been gaining market share in 2020. Just 7% of the municipal bond ETF asset base is actively managed, with index-based funds dominating, according to CFRA’s First Bridge ETF database. iShares National Muni ETF (MUB) and Vanguard Tax-Exempt ETF (VTEB), which track the same S&P Dow Jones benchmark, have $18 billion and $8.4 billion in assets, respectively. Meanwhile, the $4.1 billion SPDR Nuveen Barclays Short Term Municipal Bond ETF (SHM) and the $3.4 billion iShares Short-Term National Muni Bond ETF (SUB) are popular less interest-rate sensitive alternatives. However, as the municipal bond market has become more volatile in 2020, investors are starting to gain comfort in actively managed municipal bond ETFs.
As a group, these active ETFs pulled in $1.1 billion of new money year-to-date through July 24, equal to 18% of the municipal bond ETF category’s net inflows this year. With each state facing distinct Covid-19 related issues, some investors have sought the discretion of active managers to sort through the universe of bonds. But unlike with mutual funds, investors benefit from intra-day liquidity and tax benefits with ETFs.
Chart 1: Growing Municipal Bond ETF Demand in 2020

Source: CFRA’s First Bridge ETF Database. As of July 24, 2020.
Traditional active municipal bond managers are making inroads within the ETF space. iShares, Vanguard, and State Street Global Advisors provide the largest municipal bond ETFs, consistent with their overall ETF industry leadership. However, firms with established active municipal bond mutual funds have benefited from their ETF presence in 2020.
First Trust, the sixth largest overall ETF provider with a strong index presence, runs FMB. This ETF has $1.6 billion in assets and its base has grown in 2020 aided by $346 million in net inflows. Meanwhile, MUNI, MMIN, Franklin Liberty Municipal Bond ETF (FLMB), and JPMorgan Municipal Bond ETF (JMUB) are other core, active municipal bond ETFs that gathered assets in 2020. These latter four ETFs are managed by firms also offering established, but more expensive, active municipal bond mutual funds.
Table 1: Select Actively Managed Municipal Bond ETFs
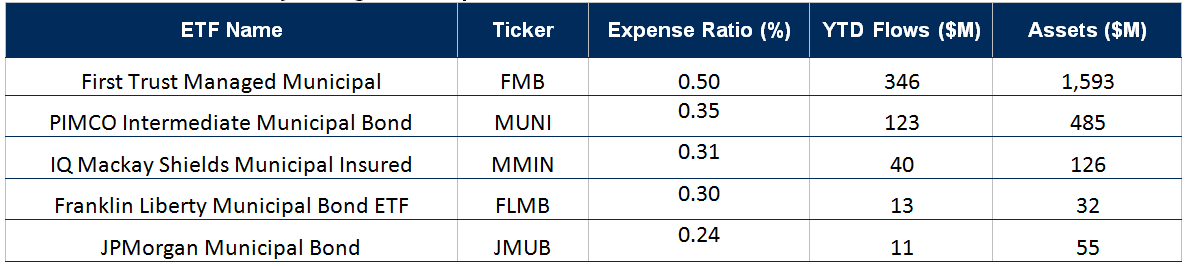
Source: CFRA’s First Bridge ETF Database. As of July 24, 2020.
For example, MUNI charges a 0.35% expense ratio that is less than half the fee for the 0.75% PIMCO Municipal Bond Fund (PMLAX). Both funds are managed by David Hammer, who heads PIMCO’s Municipal Bond department. MMIN is managed by a team at NY Life’s Mackay Shields that also runs Mainstay Mackay Tax Free Fund (MTBAX). MMIN’s 0.31% fee is also much smaller than the 0.78% for the mutual fund retail share class. A third active ETF, JMUB is run by Rick Taormina, who also manages the 0.67% fee mutual fund JPMorgan Tax Free Fund (PMBAX). Finally, FLMB’s 0.30% fee is nearly half that 0.56% Franklin Federal Intermediate-Term Tax-Free Income Fund (FKTIX). The two Franklin products are managed by James Conn, though other portfolio managers contribute to the selection of securities.
While there are some portfolio differences between ETFs and mutual funds from the same firm, the cost savings is notable. Municipal bond mutual fund investors tend to be more buy and hold, but we think they should consider cheaper and likely more tax-efficient ETFs if they are comfortable with the investment strategy and performance records.
CFRA rates ETFs and mutual funds differently even if run by the same manager. With municipal bond ETFs, active funds such as FMB and index-based ones like MUB, we provide a risk, reward, and cost assessment relative to a broader fixed income ETF universe that includes taxable bond products. We decided that with just 59 municipal bond ETFs, there were not enough of these type of ETFs to have a separate star rating category and methodology for them. We grouped all fixed income ETFs together, including municipal bond and taxable bond ETFs. In contrast, there are well over one thousand municipal bond mutual funds and we felt that sample was sufficiently large to have its own star rating category to sort through the potential future leaders and laggards. So, for PMLAX and the more than 1,600 other municipal bond mutual funds, we split out the asset category from credit focused and government-focused mutual funds. For both ETFs and mutual funds we incorporate some of the same holdings-based metrics such as interest-rate sensitivity, and fund-specific metrics, like expense ratio and performance, but we rely more on the holdings for ETFs and the fund attributes for mutual funds. This results ETF and a mutual fund managed by the same personnel and with a similar strategy to receive different ratings.
Conclusion
Demand for actively managed municipal bond ETFs should continue to increase as investors see some of the benefits. We think firms offering active mutual funds should be among the beneficiaries as they have long track record to point to and a sizable client base that is paying too high a premium relative to index based alternatives.
Todd Rosenbluth is Director of ETF & Mutual Fund Research at CFRA.
Disclosure
All of the views expressed in this research report accurately reflect the research analyst’s personal views regarding any and all of the subject securities or issuers. No part of the analyst’s compensation was, is, or will be, directly or indirectly, related to the specific recommendations or views expressed in this research report. For more information and disclosures, please refer to CFRA’s Legal Notice at https://www.cfraresearch.com/legal/.
Copyright © 2020 CFRA. All rights reserved. All trademarks mentioned herein belong to their respective owners.
