By Scott Opsal, The Leuthold Group
The Exchange Traded Fund industry began in January 1993 with the launch of SPY, a fund designed to track the S&P 500 Index. The concept behind the first ETF was to offer investors a single, low cost, easily traded security that provided exposure to the entire market. The second U.S. ETF tracked another broad market index, the S&P 400 MidCap, but after that the industry began to morph into funds offering targeted baskets of stocks that provided exposures to narrower themes.
The iShares family launched individual country ETFs in 1996, which were essentially niche exposures for U.S. investors. The SPDR family followed with sector funds in 1998, and in 2000 the floodgates opened as iShares rolled out sector funds and style box funds. The ETF concept began as a vehicle to provide low-cost access to a broad market index, and the phrases “passive”, “cheap”, “index”, and “ETF” were often used synonymously. However, ETFs soon evolved into specialty funds that allowed investors to take focused active tilts in sectors, styles, and countries; a landmark shift away from the notion of passively investing in the broad market.
Today’s ETF Landscape
The ETF marketplace today is a far cry from that envisioned in the pioneer days. Originally conceived as the investment equivalent of plain vanilla ice cream in a generic cardboard container, today’s offerings include more flavors than Ben & Jerry, including funds that target ultra-narrow themes, carry high expense levels, and are (horror of horrors!) actively managed – the ice cream equivalent of premium, hand-packed mint chip!
We were curious to understand the evolving ETF landscape, particularly from the perspective of understanding what investors desire from ETFs. This study draws on the Morningstar Direct database of U.S. ETFs to analyze what roles ETFs are being asked to play, and to learn how investor demand has broadened from vanilla to include butter pecan, rocky road, cherry chocolate, and even more exotic flavors.
The first set of exhibits covers all domestically listed ETFs beginning in 2001. Because the genesis of the ETF design was to offer passive, low-cost investment vehicles, our analysis is designed around expense levels.
Chart 1 disrupts the original narrative for ETFs by showing the percent of funds in each annual expense bucket as shown on the horizontal axis.

ETFs with expense loads greater than 50 basis points accounted for more than 40% of the universe in 2001 and in 2021. This collection of “not so cheap” funds stands in contrast to the small percentage of funds in the “super cheap” first category, dispelling the notion that ETFs are synonymous with very low fees.
Chart 2 plots the median annual expense level for all ETFs, providing a different perspective on the results in Chart 1. Today, when some of the largest core ETFs charge a fee of just 3 basis points, it is illuminating to see that the broad ETF market has never been quite as low cost as we imagined. The median expense (blue line) level hovered near 30 bps in the early years, but as funds became more specialized the median rose above 50 bps and has remained near that level.
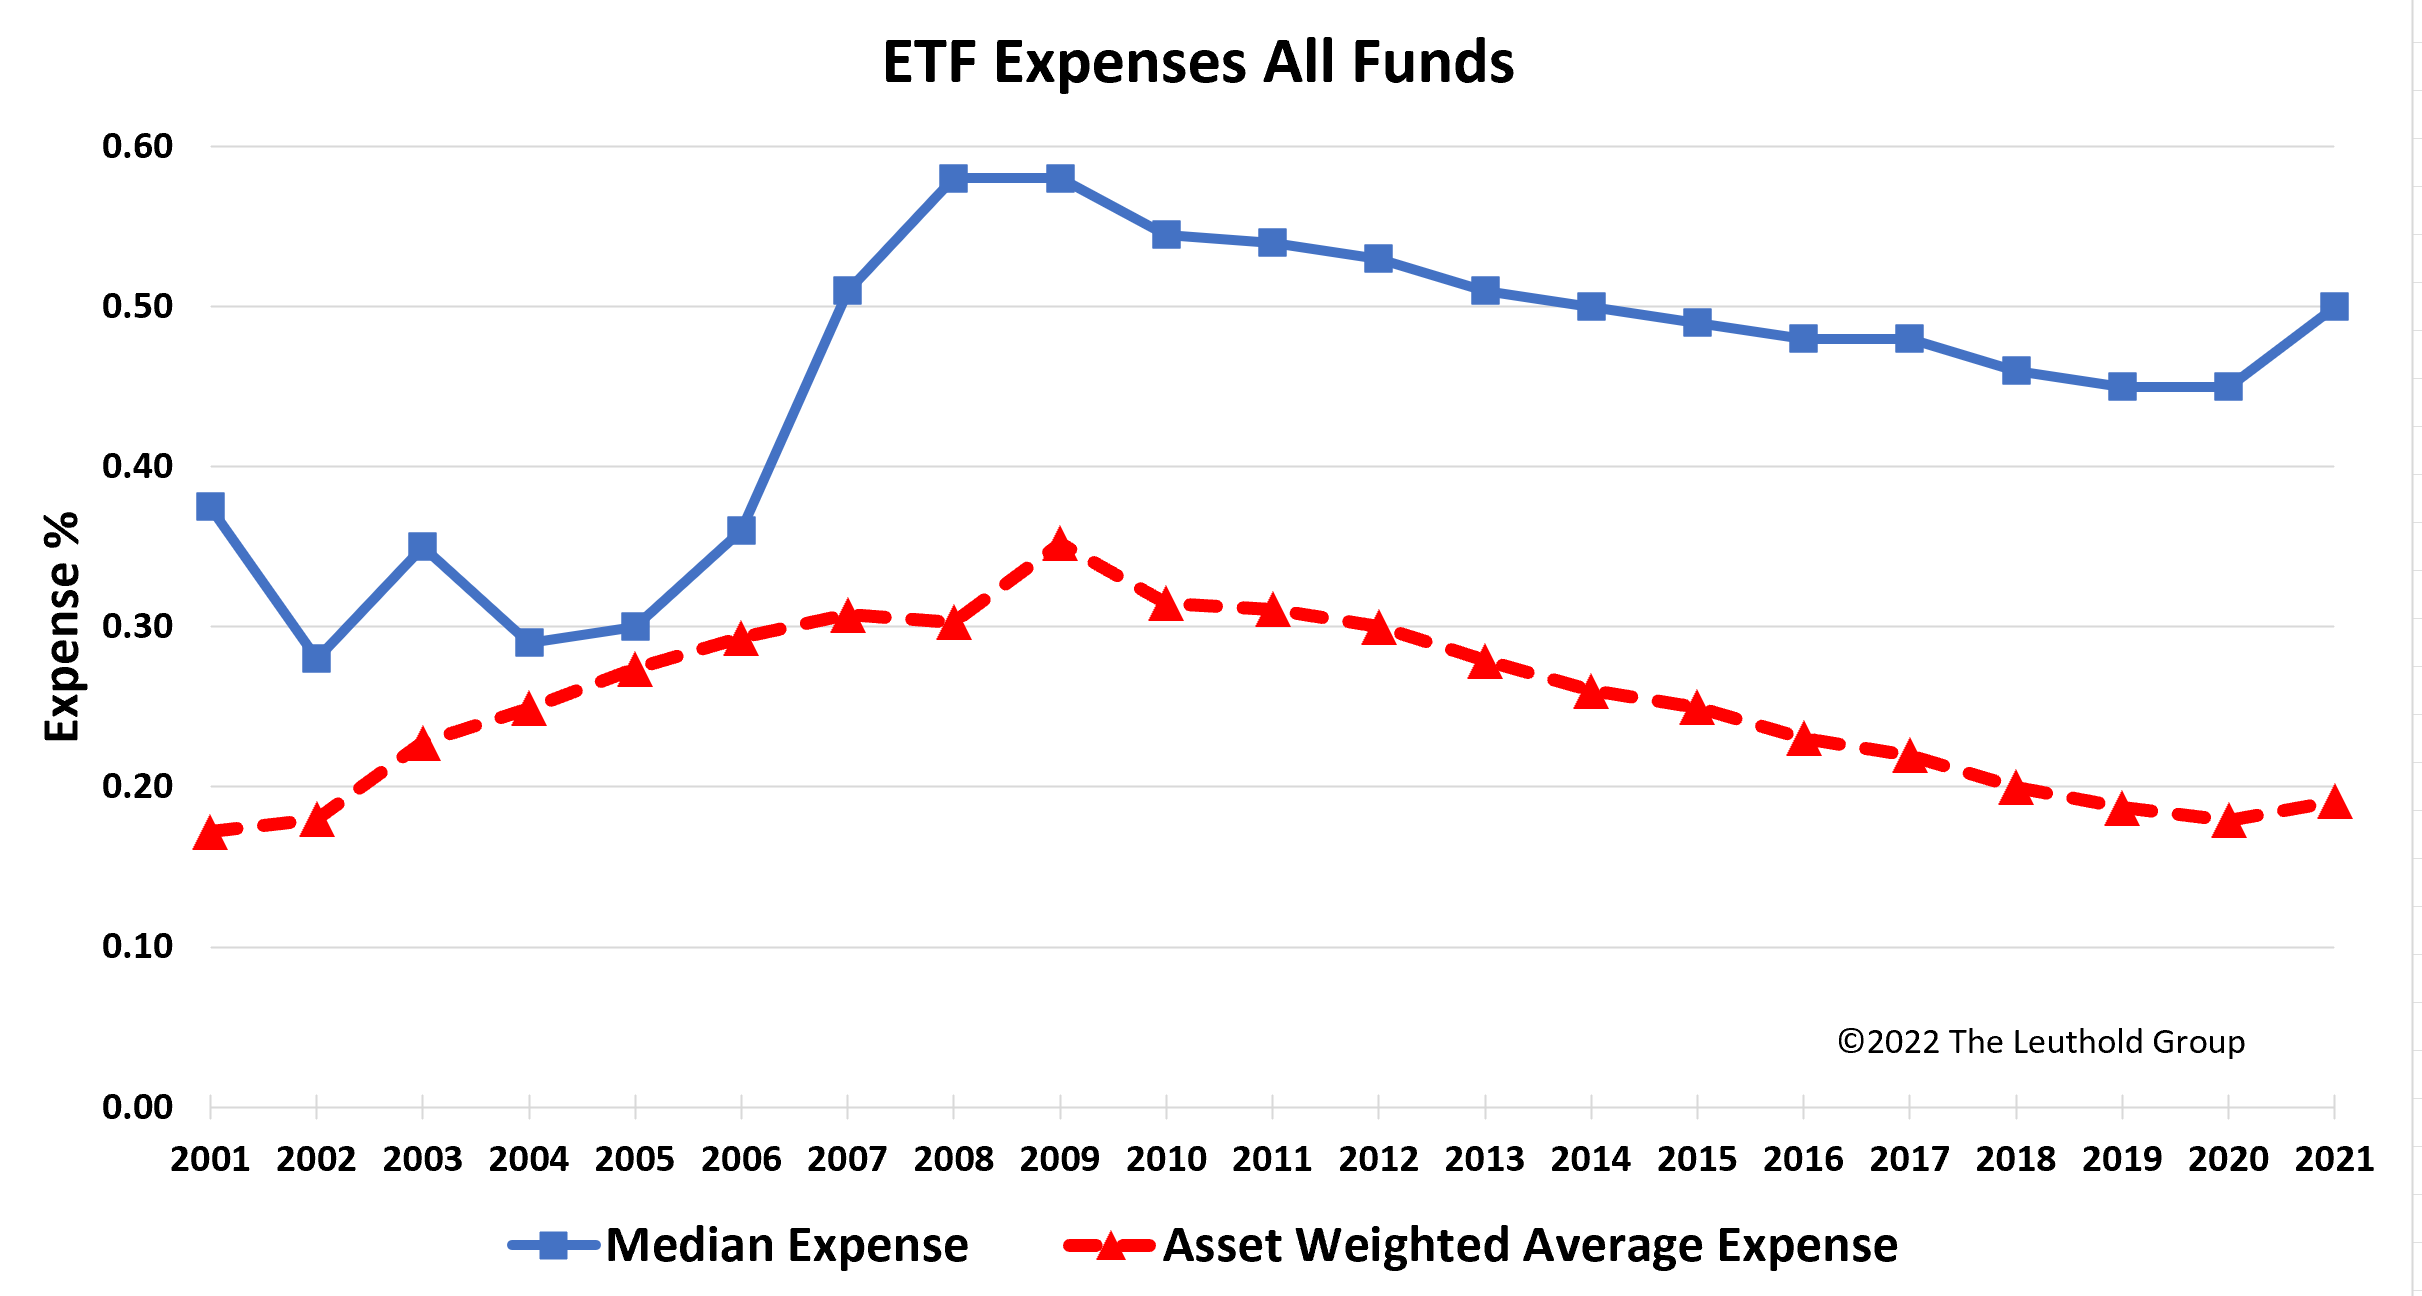
Chart 2 also plots the asset-weighted average fund expense (red line) which tells a stronger story for investors looking to minimize fees. Because the passive vanilla funds are both the largest and the lowest cost offerings, the weighted fund expense has slowly declined from 30 bps to 20 bps in the last decade. This dichotomy between the median ETF and the asset-weighed universe intrigues us, and we explore these various angles in Charts 3 through 5.


We conducted a time series analysis of the ETF market categorized by expense levels. Chart 3 leads off by parsing the number of funds in each fee basket by year. Each shaded bar represents the percent of total funds in each category (left axis) while the digits in each bar show the actual headcount per basket. The two lowest expenses categories accounted for about 35% of the universe in the early years, but by 2009 these same groups were less than 20% of the headcount. Funds charging more than 50 bps (yellow bars) claimed more than half the market by 2008, and they continue to represent the single largest cohort in our study.
While investors have embraced specialized funds that are also more expensive, the attraction of low fees shows up in Chart 4 as it calculates the percentage of total ETF assets grouped by fee level. Roughly half of all ETF assets are parked in funds at the lowest fee level of 10 bps or less. Asset allocators are able to build portfolios that have exposures to core asset classes at minimal cost. Another quarter of total assets are in the range of 10 bps to 25 bps, suggesting that ETFs’ original mission of providing low-cost broad market access is still the main appeal to many investors.
Chart 5 tallies annual net asset flows by expense bucket, and the most interesting aspect of this exhibit is the wide fluctuations in the lowest fee category over time. In recent years, roughly 60% of ETF fund flows went to low fee offerings while the high fee baskets absorbed less than 30% of the flows. However, historical periods of market weakness see reduced flows into the cheapest funds with the slack taken up by significant flow gains in the pricier groups.
The low fee basket consists of broad market funds built to offer core asset class exposure, whereas the higher fee funds provide narrow, targeted themes that reflect investors’ desire to take a certain active position. In that light, the trends in annual fund flows make perfect sense. In years when investors are making wholesale allocations into (bull markets) or out of (bear markets) core asset classes, the low-cost pool will see fluctuations in fund flows. Conversely, when investors are prioritizing tactical calls over broad asset class exposures, the more expensive and more focused funds will gobble up a greater share of flows.
Asset Class Analysis
The foregoing analysis covers the full range of U.S. ETFs, and we were curious to learn if segmenting the universe by asset class would yield any new insights. We divided the ETF universe into the asset classes of (1) domestic equity, (2) international equity, (3) fixed income, and (4) alternatives, compiling the same statistics for each basket.
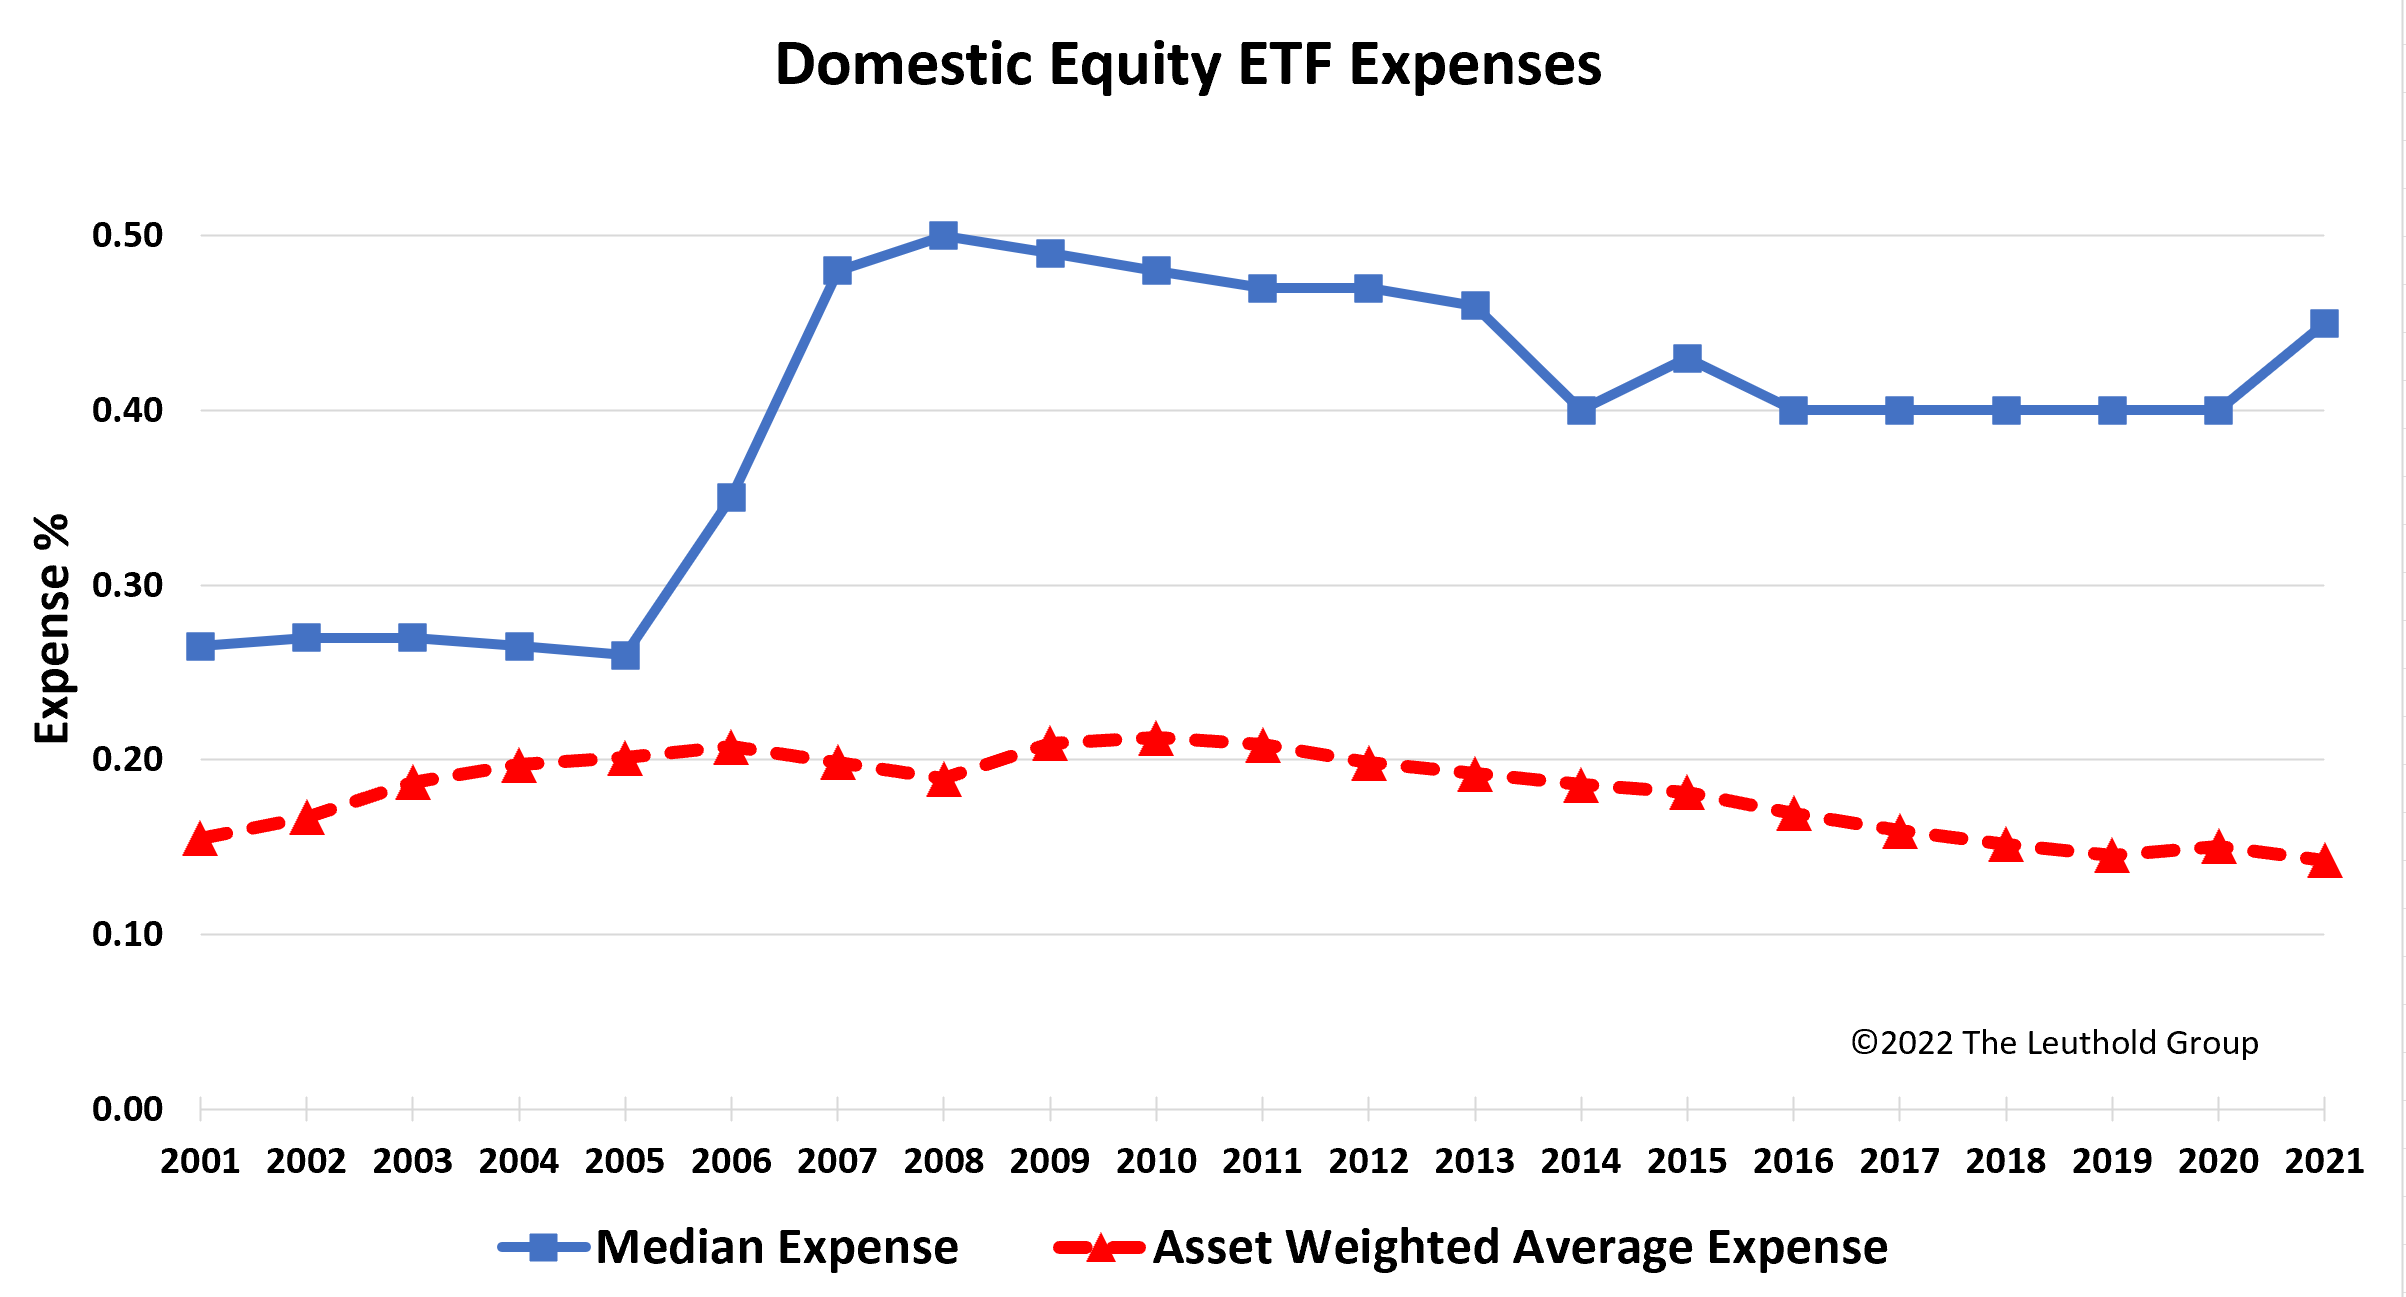
Chart 6 shows the median and asset-weighted average expense levels for domestic equity funds. The median fee has ranged between 40 bps and 50 bps for over a decade, while the gigantic scale of the broad market funds brings the average fee down to 15 bps.
The majority of the stacked bar charts for each asset class are similar in pattern to the overall universe, so for brevity and readability, we placed them in a supplemental chart exhibit in the Appendix at the end of this report.
International equity ETFs have seen the greatest impact of scale, as Chart 7 shows the asset-weighted expenses trending down consistently since 2009. The median fund expense of 50 bps has remained flat, once again indicating that investors are willing to pay for narrow international exposures that play a diversifying role in their portfolios.
Fixed income ETFs command lower median fees than either equity subset, and Chart 8 shows that the average fee has fallen to a level similar to that of domestic equities. Fixed income ETFs seem to be particularly cost effective, and core positions in broad domestic equity and fixed income indexes can be obtained for well under 20 bps.

The alternative assets basket is where the ETF story really transitions from cheap vanilla market exposure to a focus on narrowly defined funds that access unique assets that are typically not part of a portfolio’s stable core. Chart 9 shows the median fee for alternative asset ETFs has been more than 90 bps for most of the decade, and the asset-weighted average was often north of 60 bps. These are asset classes where investors desire a particular niche position and are willing to pay full fees to gain that specific exposure in one easy-to-trade security.

Alternative assets is the only subgroup where the asset weighted average fee has risen over time, and is now close to the median fee. We identify two culprits behind the rise in average expenses over the last three years. First, the popularity of 2x and 3x levered ETFs (which we include as alternative assets) has risen, and they carry substantially higher expense levels. Second, Morningstar includes some newer cryptocurrency funds in the ETF universe. Crypto funds account for the sharp spike in average expenses in 2021, as these funds have more than $30 billion in assets and can charge 200 bps or more in fund expenses.
As shown in the supplemental section, the equity and fixed income charts for fund count, assets, and flows by expense category look similar to Charts 3, 4, and 5 that reference the full universe. However, this is not the case for alternatives. In the alternative asset space, the bulk of the fund count, assets, and flows all accrue to the highest fee basket. Chart 10 illustrates the dramatic difference in assets under management sorted by expense levels (compared to the full universe in Chart 4). Clearly, investors in alternative asset ETFs are willing to pay dearly to gain an active exposure to a specific and highly coveted asset.

The Evolving ETF Landscape
When SPY came to life in 1993, its objective was to provide low-cost access to a broad market index in a single tradeable security. This innovation allowed investors who desired passive asset class exposure to gain such a position with minimal effort and minimal cost. As such, the terms “passive”, “low cost”, and “ETF” became synonymous.
Over time, ETF development has branched out along a second path that is noticeably different from the first. Newer funds retain the benefit of being an easily tradeable single security but alter the investment angle to include narrowly defined themes for which portfolio managers are willing to pay a much higher fee. These specialty funds are easy to trade and tax efficient, but they do not fall under the labels of cheap, passive, or broad market.
Our ETF survey reveals that the majority of ETFs are narrow, thematic funds that carry moderate to higher fees. However, the bulk of ETF assets remain in the broad, low-cost funds that usually represent passive core allocations in investor portfolios. From the start, passive ETFs delivered an inexpensive plain vanilla flavor with wide appeal. Over time, ETFs have evolved into a veritable Ben & Jerry’s lineup of unique flavors that each have their own devotees who are willing to pay a premium price for the particular flavor they desire. Rather than just gaining exposure to the broad market, investors are buying ETFs to access specific styles and themes that bring a desired perspective to their portfolios, tapping into select market niches through instruments that are easy to trade and very tax efficient.
For more news, information, and strategy, visit ETF Trends.
