
Inflation, as measured by the Consumer Price Index (CPI) or Personal Consumption Expenditures Index (PCE), reflects the sustained rise in prices for goods and services. In the U.S., it results from an interplay of demand-pull, cost-push, and built-in factors amplified by monetary policy and global shocks. Post-2021, CPI peaked at 9% in June 2022 before moderating to around 3% currently, which emphasizes these dynamics.
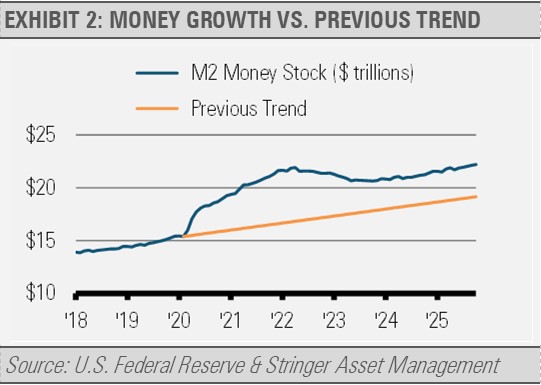
Demand-pull inflation emerges when the need for goods and services outpaces the supply, often fueled by fiscal stimulus or loose monetary policy as well as the impact of supply constraints. The 2020–2021 CARES Act and American Rescue Plan injected over $5 trillion into the economy, boosting household spending amid supply constraints from COVID-19 lockdowns. At the same time, the U.S. Federal Reserve (Fed) cut interest rates and purchased trillions of dollars of bonds, thereby flooding the financial system with new money. As the graph below illustrates, the amount of money in the U.S. economy as measured by M2, which includes currency, check and savings accounts balances, and money market assets, etc., ballooned because of these combined policies. By the spring of 2022, the amount of money in the economy was nearly $5 trillion higher than it otherwise would have been as compared to the previous business cycle trend. Excess savings peaked at $2.3 trillion, driving consumption and pushing inflation higher.
Cost-push inflation stems from rising input costs transmitted through supply chains. Energy prices, particularly oil, are pivotal to this version. Crude oil (WTI) surged from $40 per barrel in 2020 to $120 in 2022 due to OPEC+ cuts and the Russia-Ukraine war, which disrupted 10% of global supply. This raised transportation and manufacturing costs: gasoline alone contributes roughly 4% to CPI but also amplifies food prices via freight. A 10% oil price hike can add 0.2–0.4% to annual inflation per the Fed’s models as energy prices cascade into approximately 70% of goods.
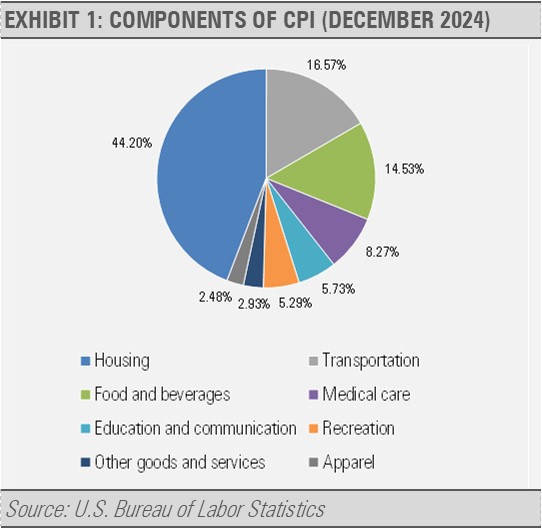
Housing, accounting for 35% of CPI, acts as a sticky driver of inflation. Shelter costs in CPI tend to lag market rents by 12–18 months due to lease structures and measurement. Post-pandemic migration to suburbs and low inventory drove home prices up 44% from January 2020 through June 2022 according to the Case-Shiller Index. The U.S. has a housing shortage due to a fall in new home construction following the housing boom and bust of the 2000s combined with continued new household formations, which makes housing a structural inflator.
Other sectors amplify these as well, such as food (14% of CPI). Food ties to energy and commodities, and wheat and corn spiked 30-50% in 2022. We continue to see food inflation today due to a variety of dynamics.
Global factors and policy responses matter, especially with respect to inflation. Supply-chain bottlenecks added 1% to 2021 inflation per IMF estimates. The Fed’s aggressive hikes of 5.25% from 2022 to 2023 curbed demand but risked a recession. The fiscal drag from expiring stimulus and higher rates now help keep the annual inflation rate down from its 2022 peak.
In summary, U.S. inflation blends government policies, cyclical shocks (e.g., oil and pandemics) and structural rigidities, such as housing supply. Monitoring the leading indicators like the ISM prices paid or Zillow’s rent indexes can help forecast trajectories. Sustaining a 2% inflation requires balanced growth, energy stability, and housing reforms in many different forms.
For more news, information, and strategy, visit the ETF Strategist Content Hub.
DISCLOSURES
Any forecasts, figures, opinions or investment techniques and strategies explained are Stringer Asset Management, LLC’s as of the date of publication. They are considered to be accurate at the time of writing, but no warranty of accuracy is given and no liability in respect to error or omission is accepted. They are subject to change without reference or notification. The views contained herein are not to be taken as advice or a recommendation to buy or sell any investment and the material should not be relied upon as containing sufficient information to support an investment decision. It should be noted that the value of investments and the income from them may fluctuate in accordance with market conditions and taxation agreements and investors may not get back the full amount invested.
Past performance and yield may not be a reliable guide to future performance. Current performance may be higher or lower than the performance quoted.
The securities identified and described may not represent all of the securities purchased, sold or recommended for client accounts. The reader should not assume that an investment in the securities identified was or will be profitable.
Data is provided by various sources and prepared by Stringer Asset Management, LLC and has not been verified or audited by an independent accountant.
