Economic Overview
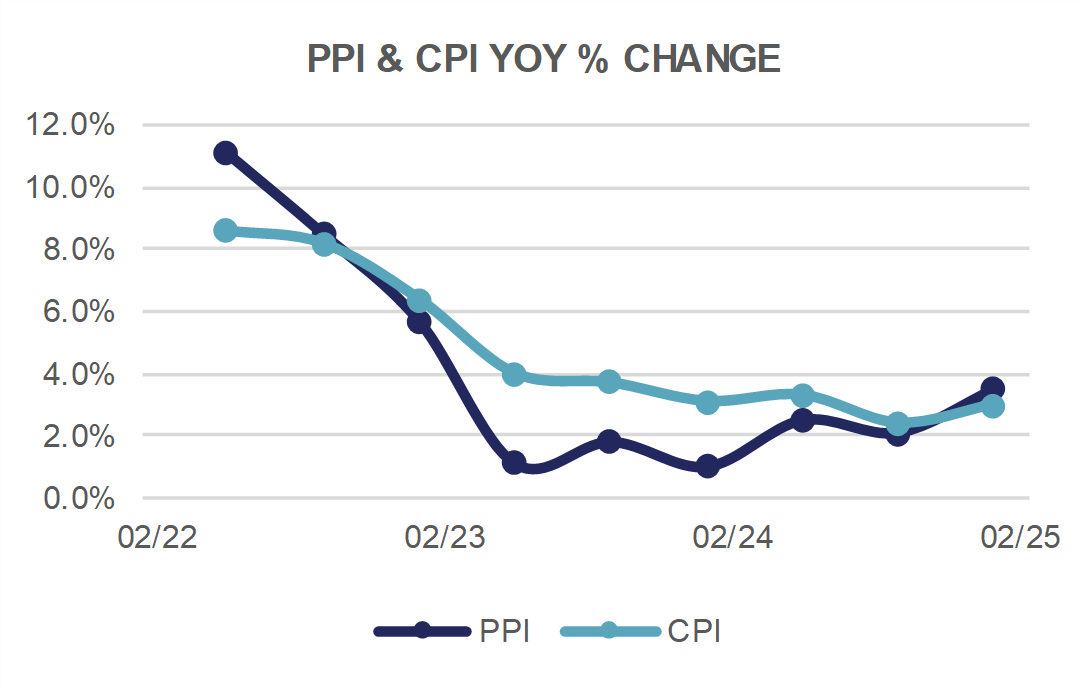
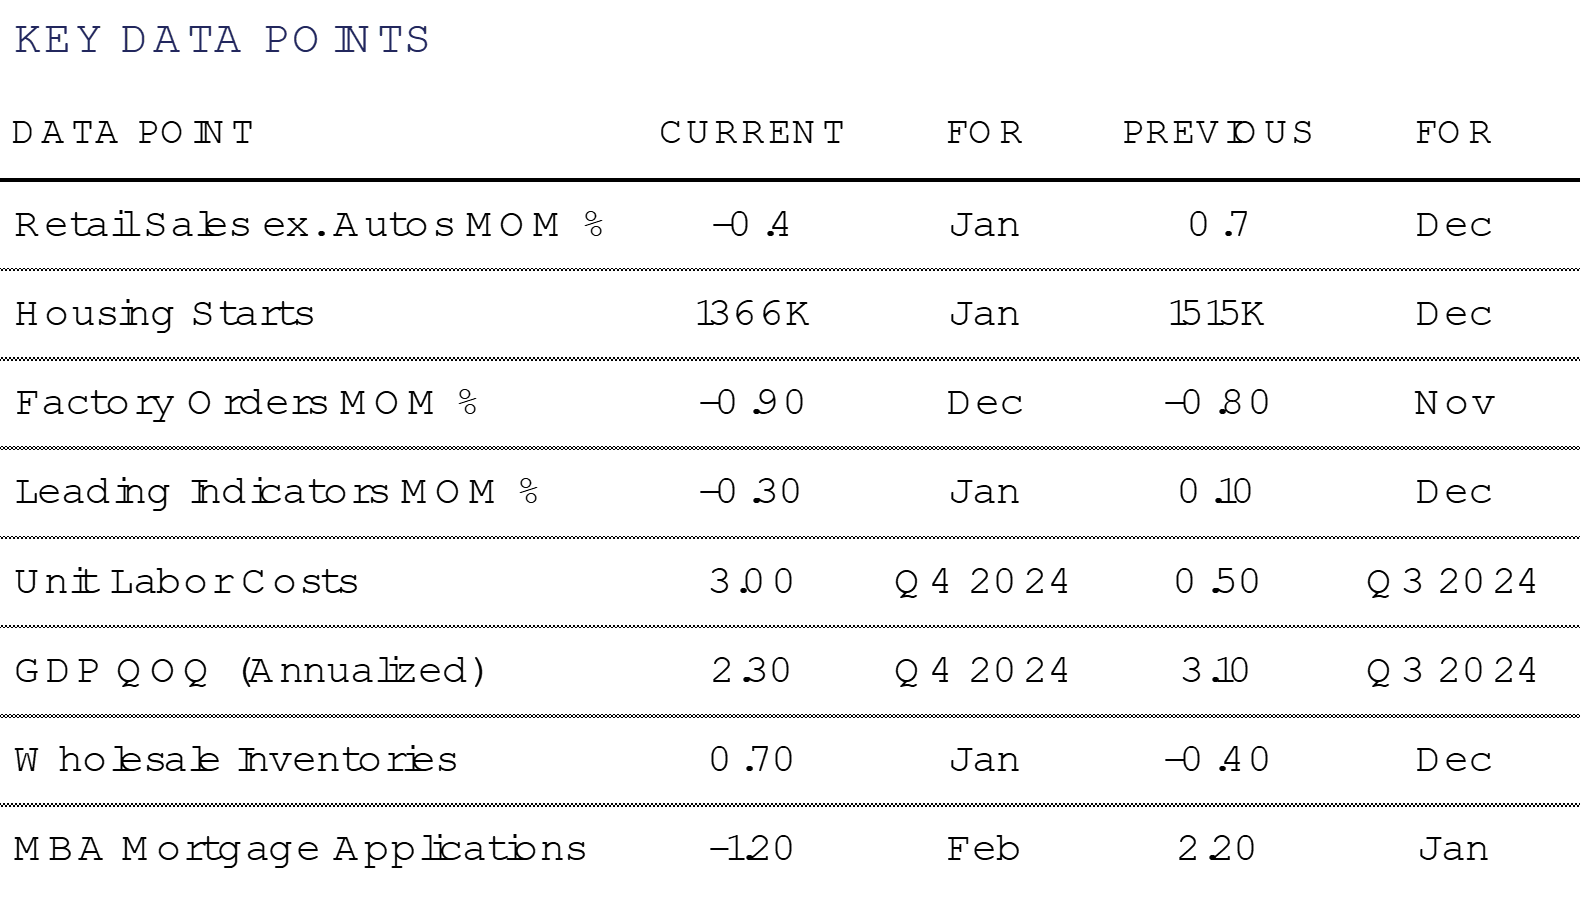
Overall, February 2025 presented challenges for the U.S. economy, including contracting GDP projections, declining housing starts, and reduced manufacturing activity. Additionally, rising inflation and decreasing mortgage applications reflect a complex economic environment influenced by policy uncertainties and global trade dynamics.
The U.S. Bureau of Economic Analysis (BEA) released its second estimate for the fourth quarter (Q4) of 2024, confirming that real Gross Domestic Product (GDP) grew at an annual rate of 2.3%. This figure aligns with the initial estimate and reflects a deceleration from the 3.1% growth observed in the third quarter.
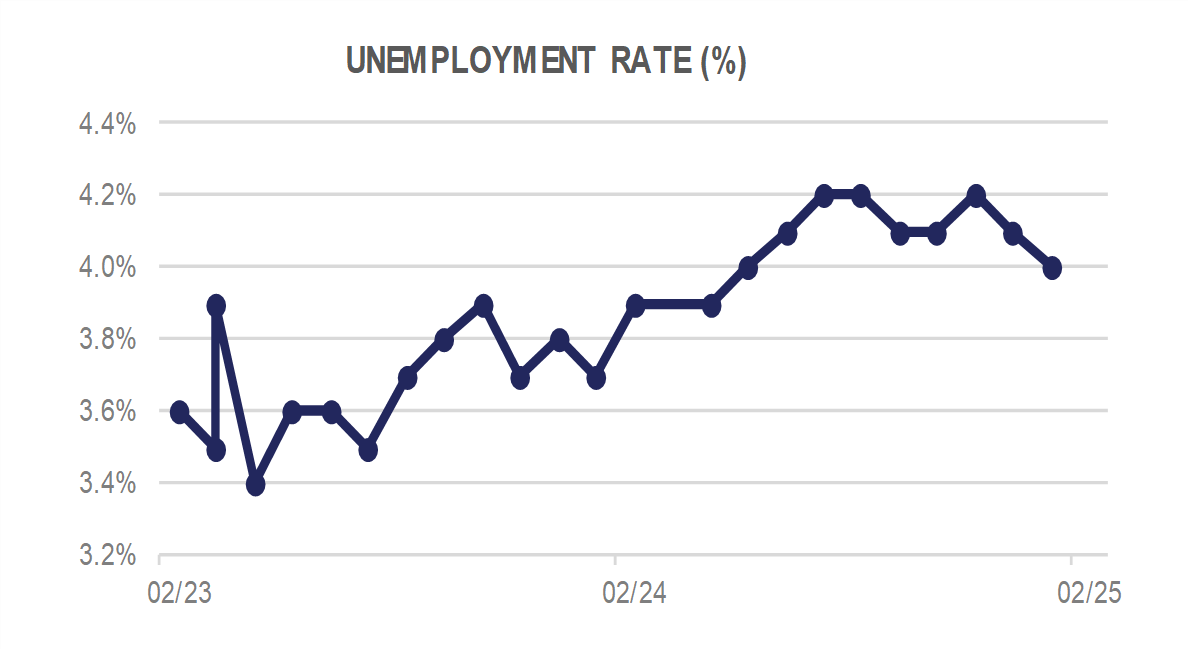
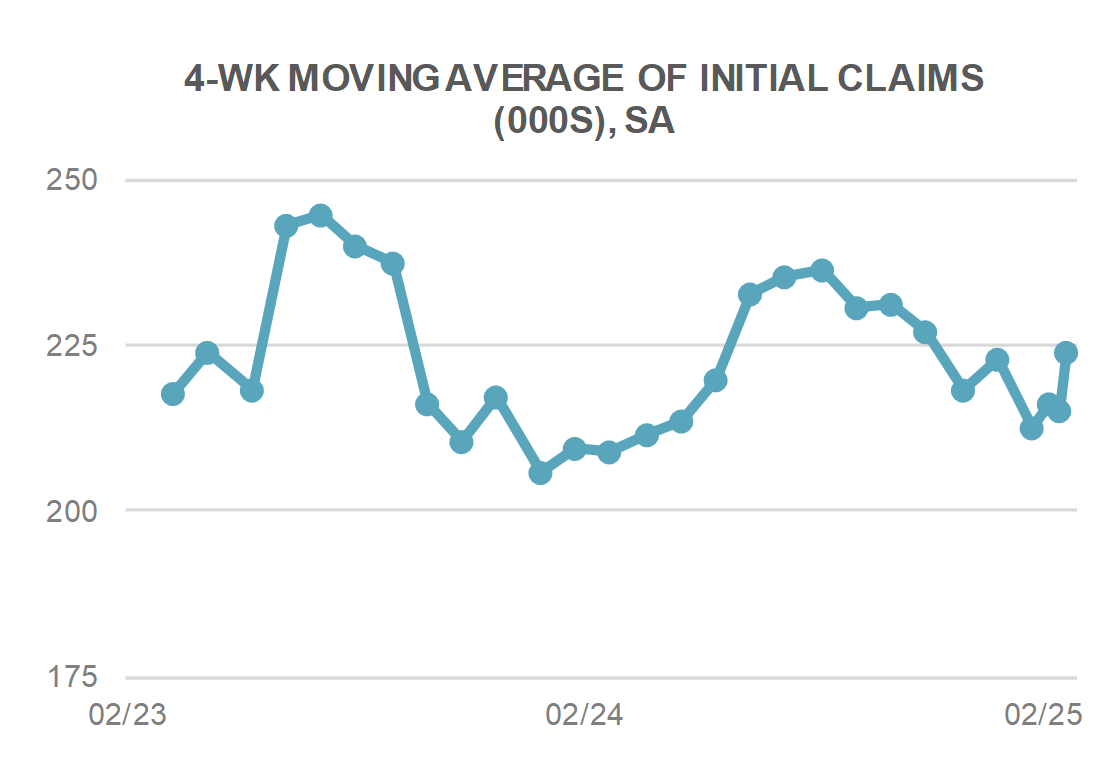
Economic forecasts for the rest of 2025 are mixed, with scenarios ranging from sustained growth to potential stagflation. President Donald Trump’s announcement of new tariffs—25% on imports from Mexico and Canada, and an additional 10% on existing tariffs for China—has introduced uncertainty in trade relations and recent data indicates a softening job market, with initial jobless claims reaching a three-month high. We have also seen a heightened goal of reducing government spending with the DOGE team now in month 2 of action.
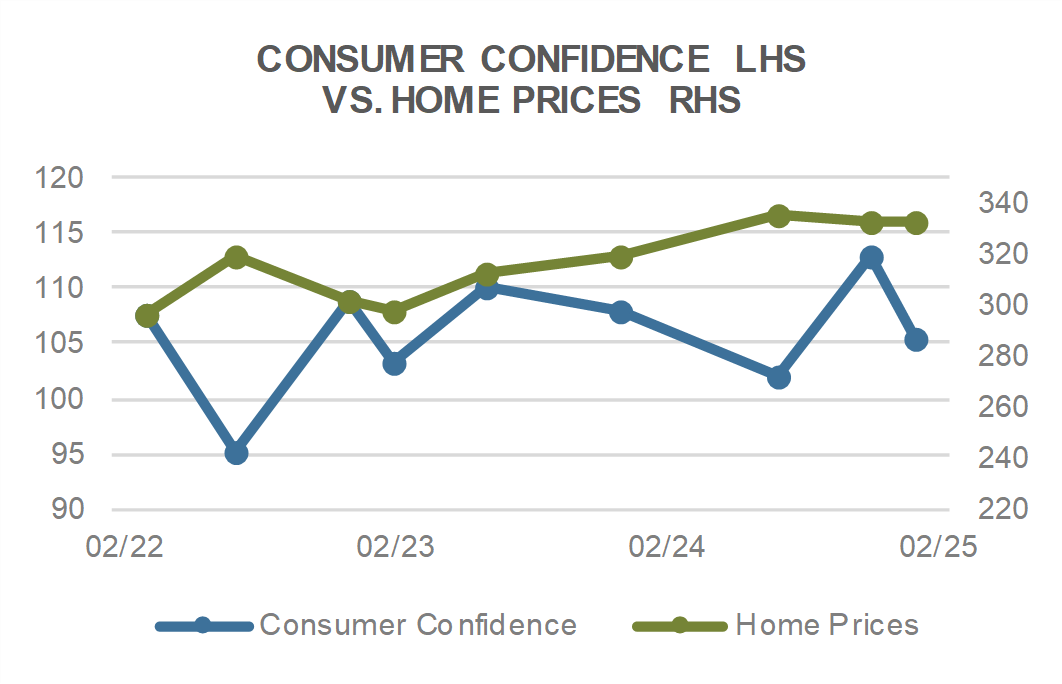
January 2025 saw a -9.8% month-over-month decline in housing starts, decreasing to an annualized rate of 1.366 million from December’s 1.515 million. This downturn indicates a slowdown in residential construction activity.
The manufacturing sector experienced a decline in new orders and employment in February. The Institute for Supply Management’s (ISM) Manufacturing Purchasing Managers’ Index (PMI) fell to 50.3 from January’s 50.9, remaining just above the contraction threshold. This decline is attributed to uncertainties surrounding impending tariffs on imports from Canada, Mexico, and China, leading to longer material delivery times and increased factory gate prices.
Domestic Equity
U.S. equities were hit by a slew of mixed data in February. Headwinds surrounding potential tariffs, a slowdown in economic activity, and heightened geopolitical tensions pressured equities of all shapes and sizes. Volatility spiked with the VIX Index rising above 20 intra-month, a signal of heightened volatility.
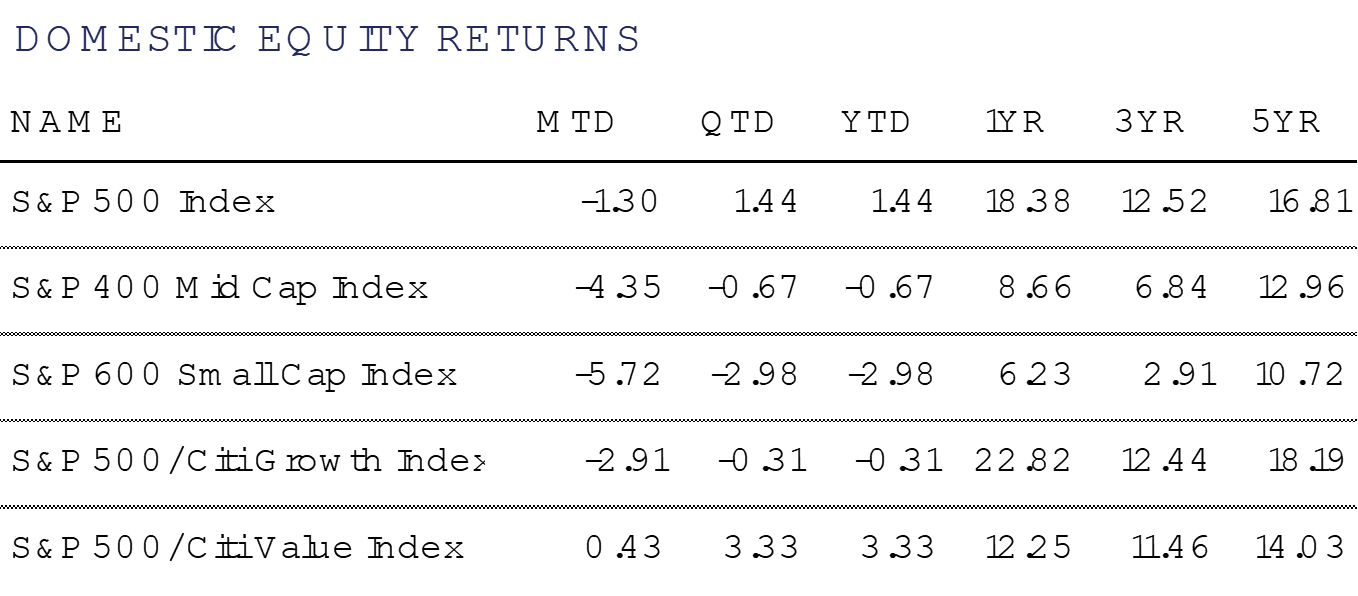
Large-Caps, as measured by the S&P 500 Index, lost -1.3% on the month to close at 5,955, after making a new all-time high at 6,147 intra-month. Mid- and Small-Caps fared worse, shedding -4.4% and -5.7%, respectively during the period, underscoring a general risk off tone throughout the month.
While Mid- and Small-Caps underperformed Large-Caps, there were mixed results under the surface. According to index provider S&P DJ Indices, annualized index dispersion in February surged to 31%, the highest in nearly two years. In layman’s terms, the difference between individual stock performance within the index hadn’t been this great in a while. That can be seen in the difference in performance of top weights in the index, with Nvidia gaining +4.0% and Tesla shedding -27.6%, or simply the Bloomberg Mag 7 Index which lost -8.7%.
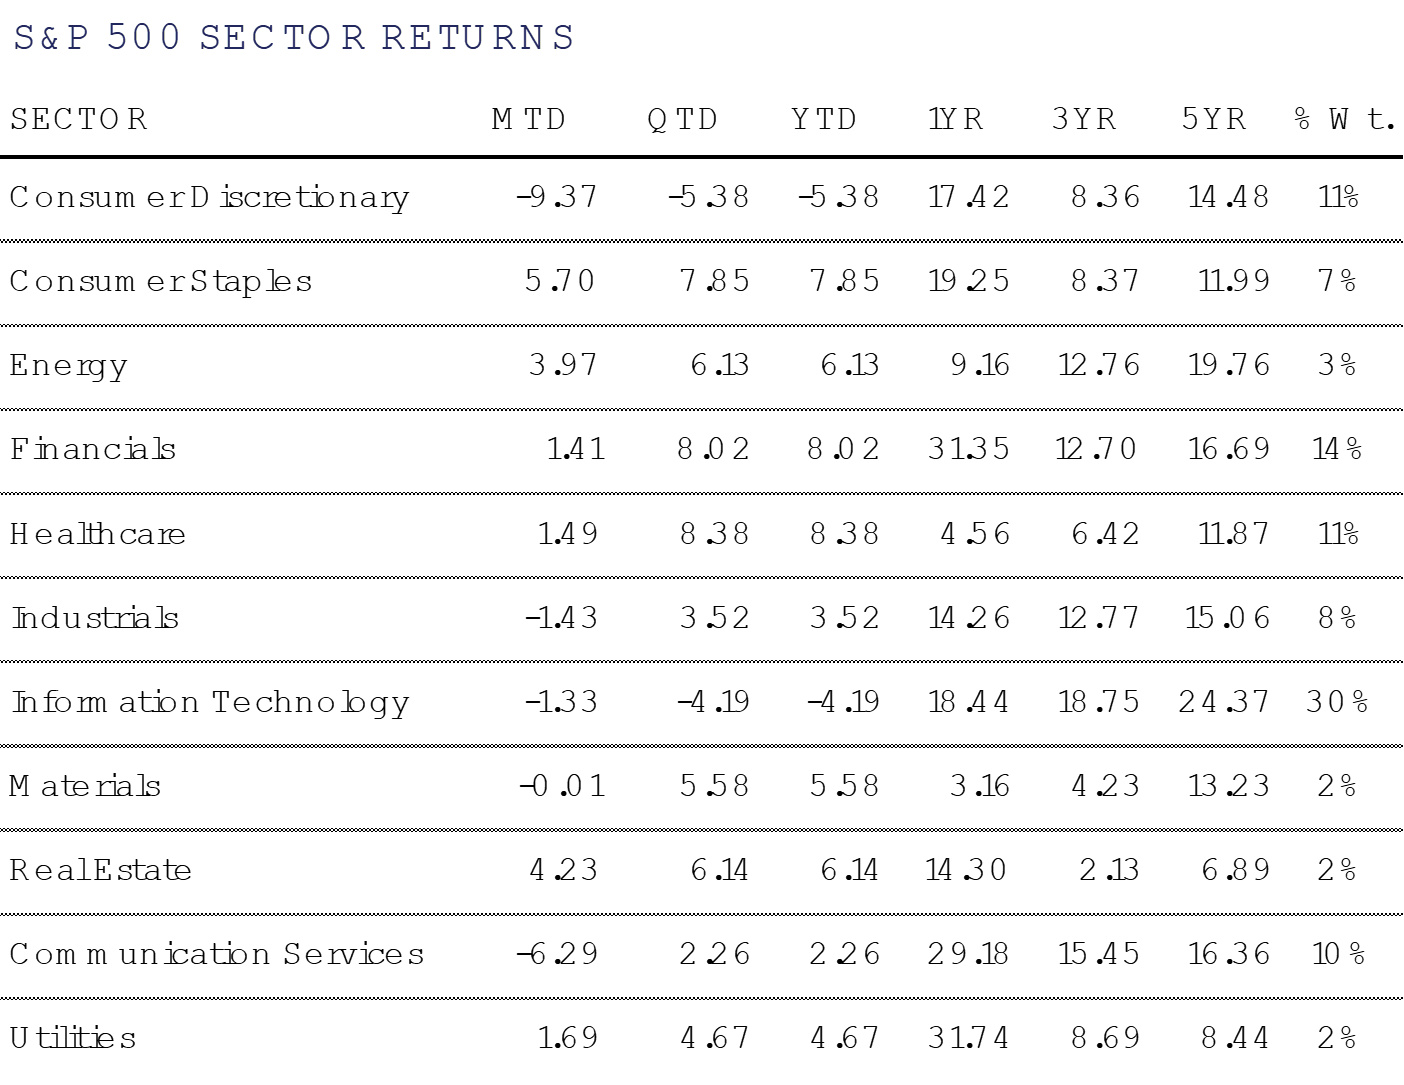
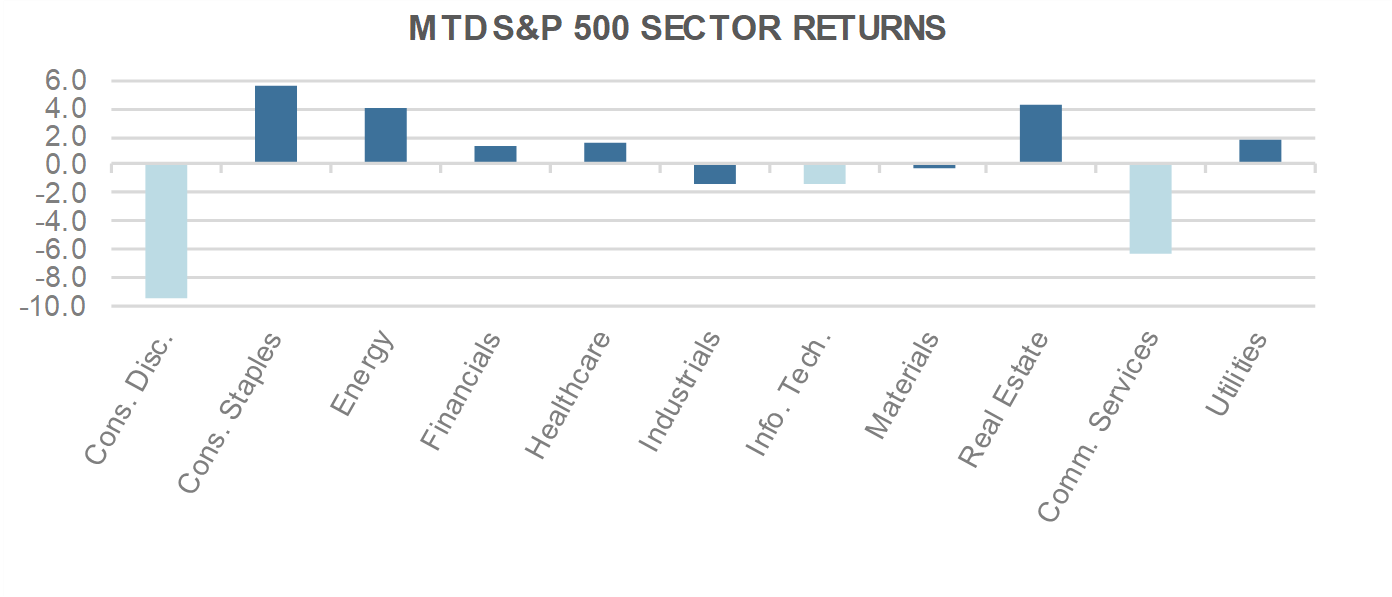
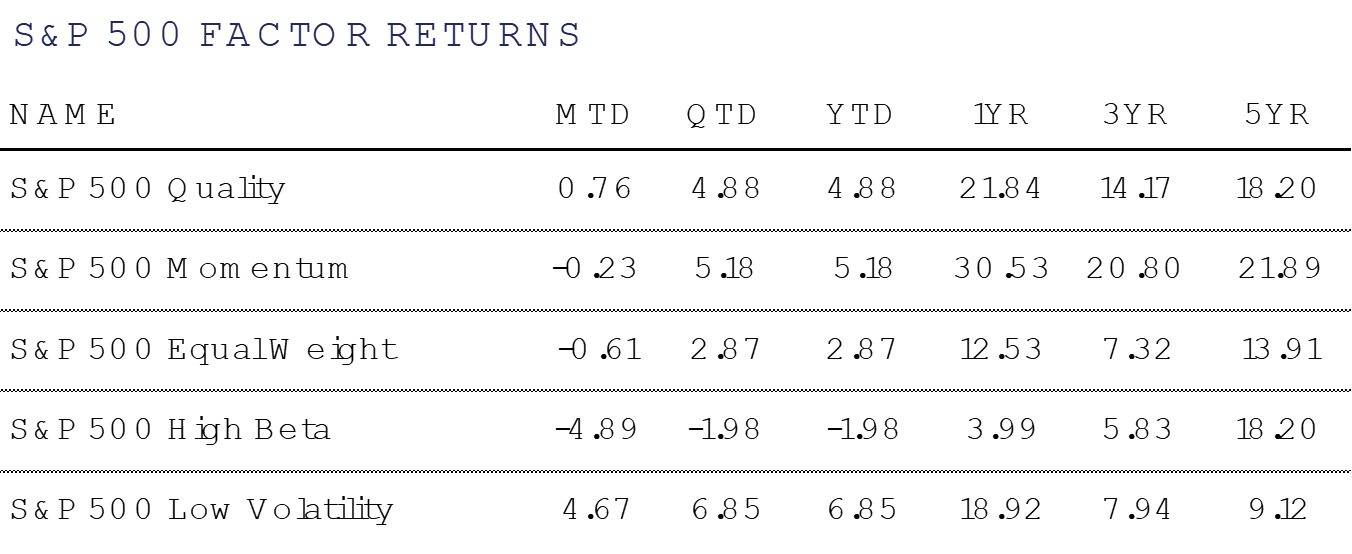
High Beta stocks, as measured by the S&P 500 High Beta Index shed -4.9% in February, juxtaposed with more defensive names in the S&P 500 Low Volatility Index, which gained +4.7% during the period. This contrast can also be seen when looking at other S&P 500 Indices including Value (+0.4%) and Growth (-2.9%), as well as at the sector level, with Consumer Staples (+5.7%), Real Estate (+4.2%), and Utilities (+1.7%) leading the pack. Worst performers included Consumer Discretionary (-9.4%) and Communication Services (-6.3%).
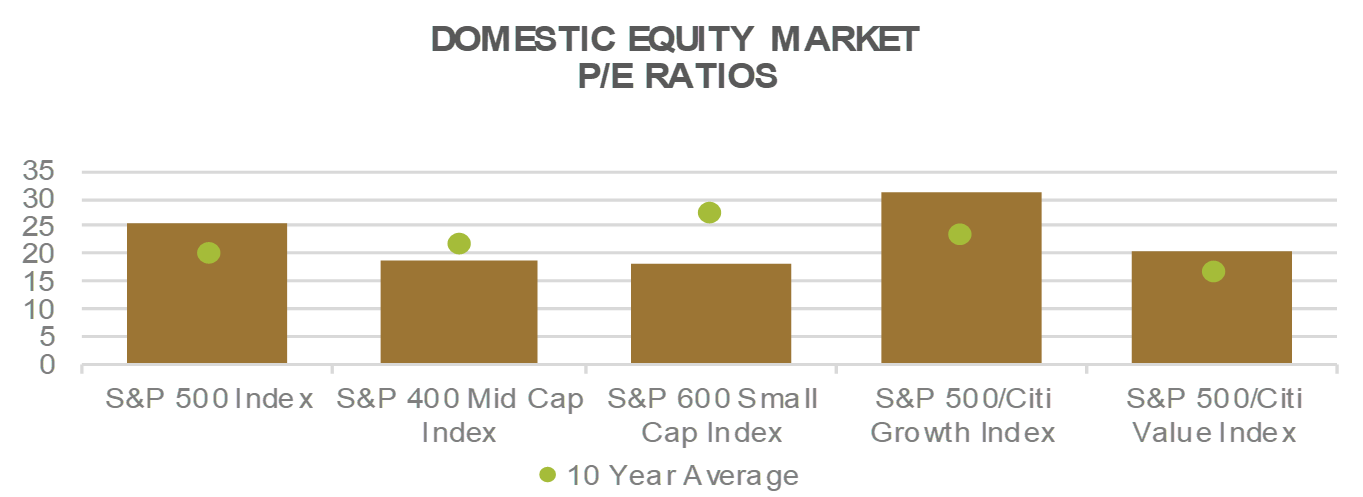
Looking at the month ahead, investors are sure to be keenly focused on tariff announcements leading into the widely anticipated April 1 report due to President Trump. The Federal Reserve meets March 18-19, and while unlikely to cut rates, will add commentary on both growth and inflation through their updated “dot plots”. Valuation remains compelling for the average stock, as well as both Mid- and Small-Caps, especially if the economy is merely experiencing a “growth scare” and not heading into recession.
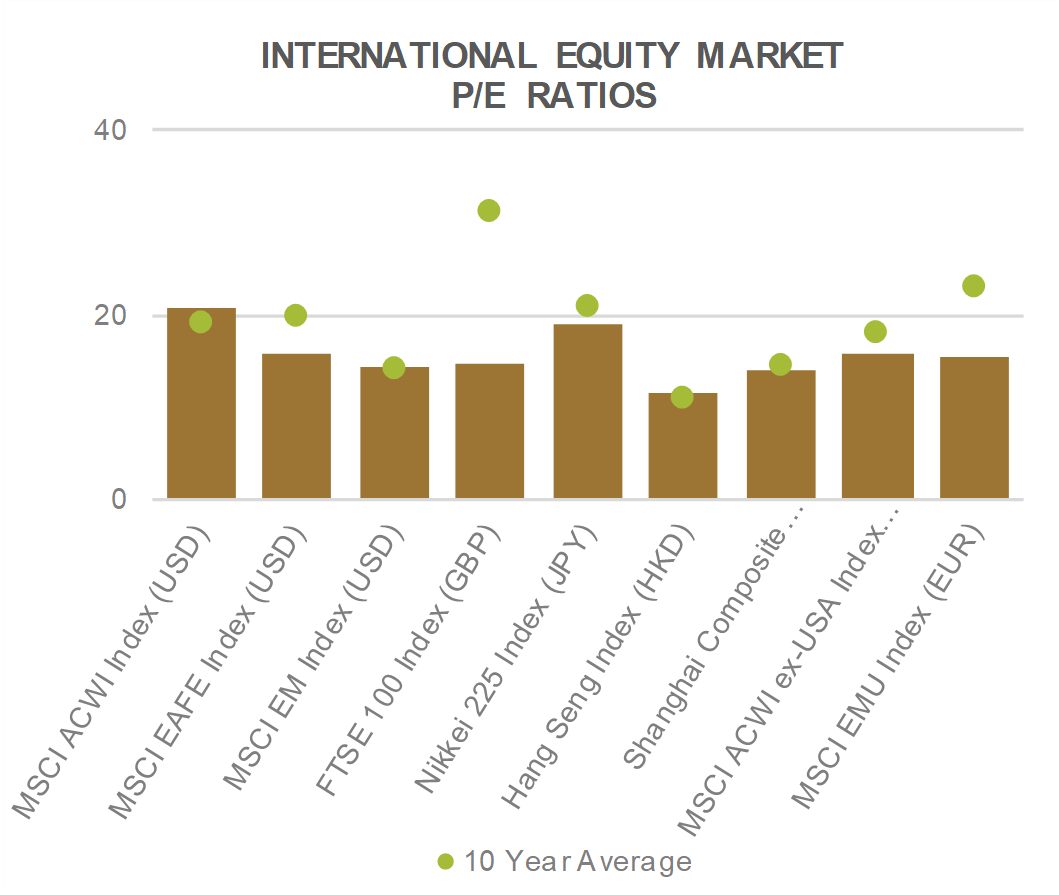
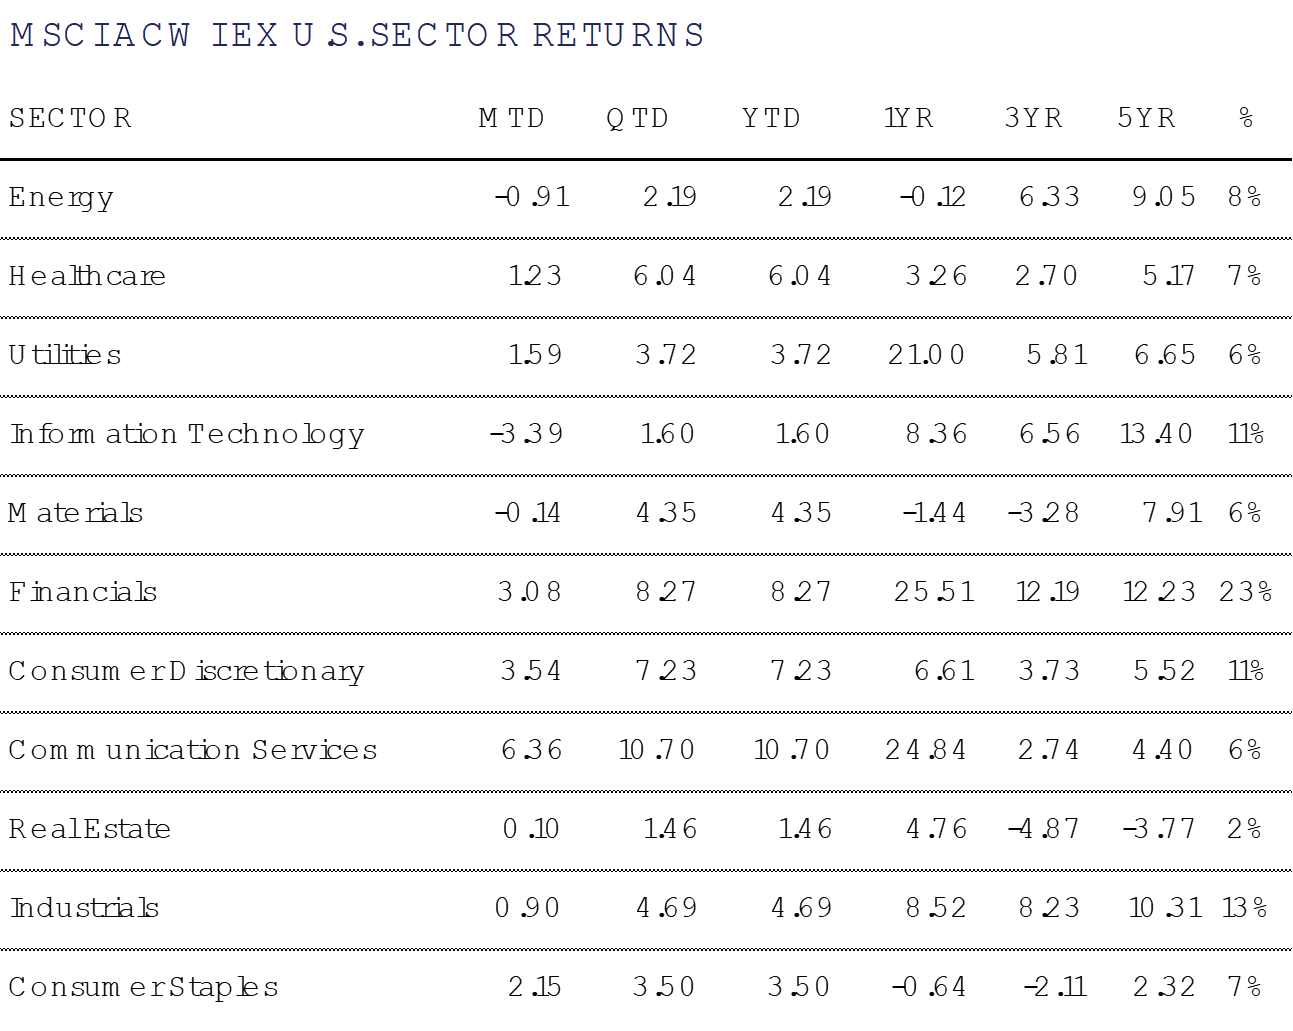
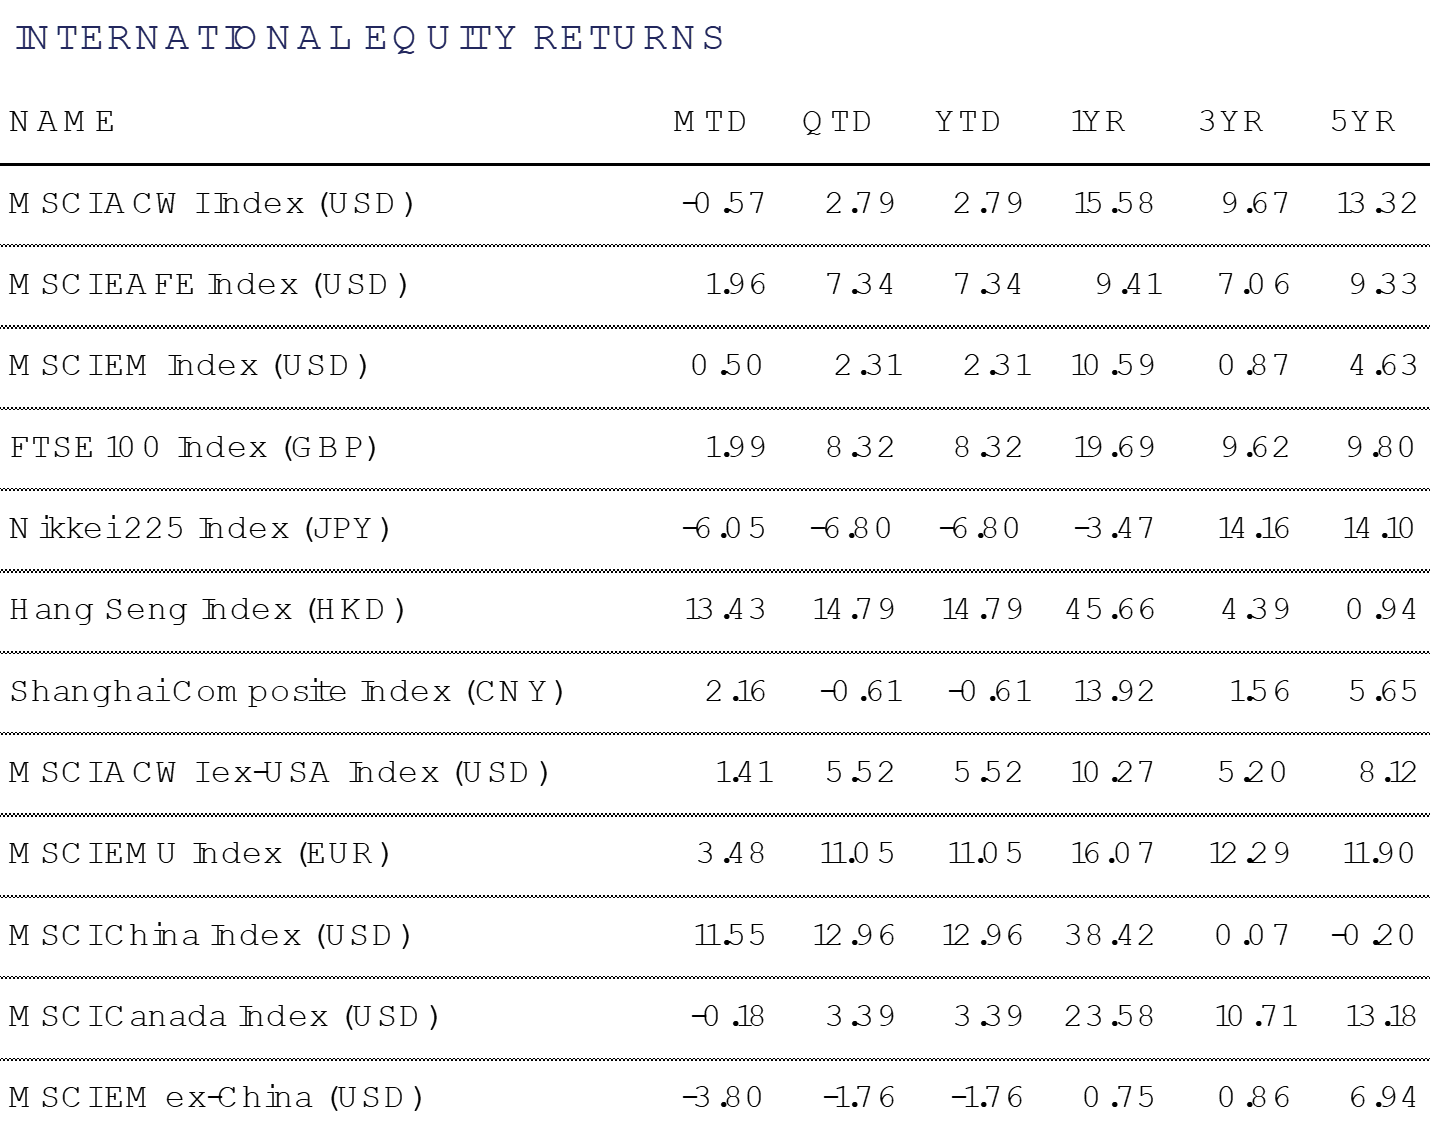
International Equity
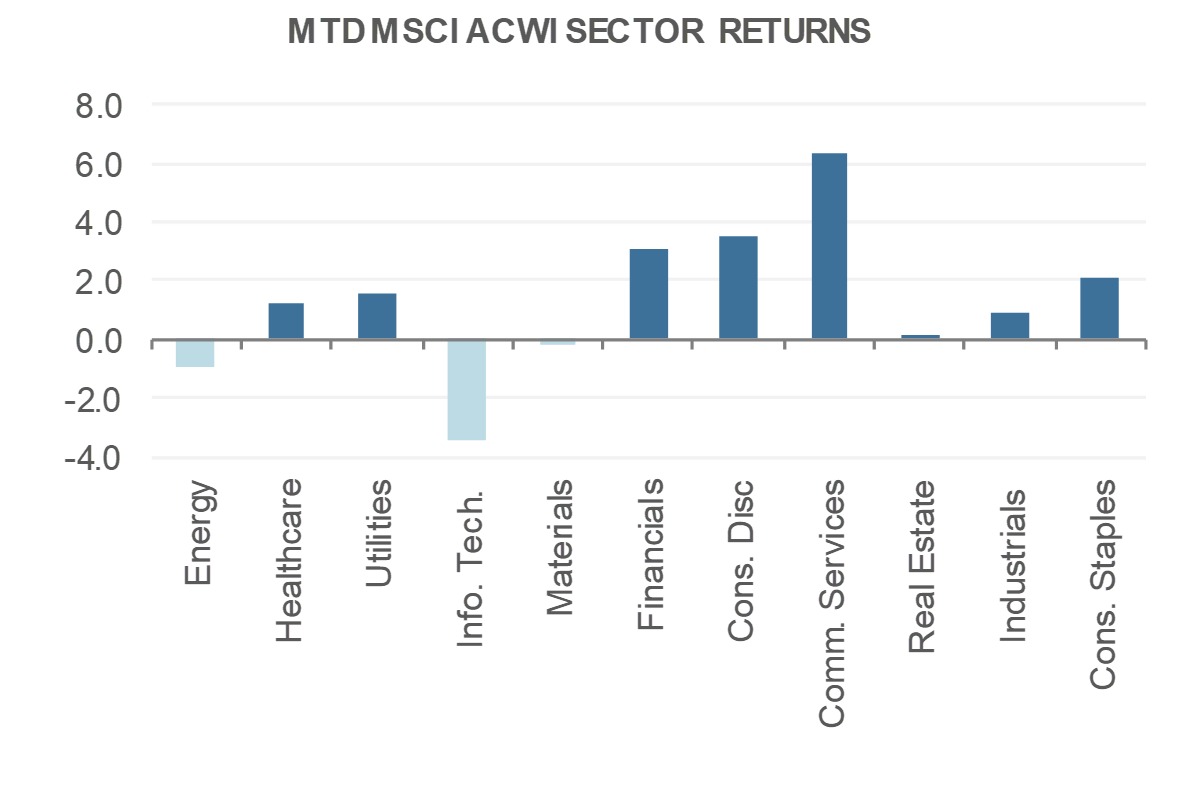
International equities had mainly positive returns last month as eight of eleven sectors in the MSCI All Country World Index posted positive returns. China had a stellar month, as the MSCI China index was up double digits, bringing YTD return to +13.0% outpacing the MSCI Emerging Markets ex-China by 14.7% this year. Developed markets displayed modest growth last month as the MSCI Europe, Australasia, and the Far East Index was up +2.0% bringing YTD gains to +7.3%.
China’s economy has rebounded following aggressive stimulus efforts late last year, but attention now turns to the upcoming “Two Sessions” meetings. Key expectations from the “Two Sessions” meetings, which refers to the two annual economic and political meetings in China, include Beijing setting its annual growth target, likely around 5%, and unveiling measures to boost domestic consumption and investment. The government is expected to increase fiscal spending, potentially up to 4% of GDP (3% last year) and increase net government bond issuance from 9 trillion yuan to 13 trillion yuan in an effort to keep the positive momentum going. Recent positive economic indicators such as recovering property sales, strong Lunar New Year consumption and advancements in AI (Deep Seek) have boosted market confidence. However, investors remain aware of external risks, including looming U.S. trade tensions.
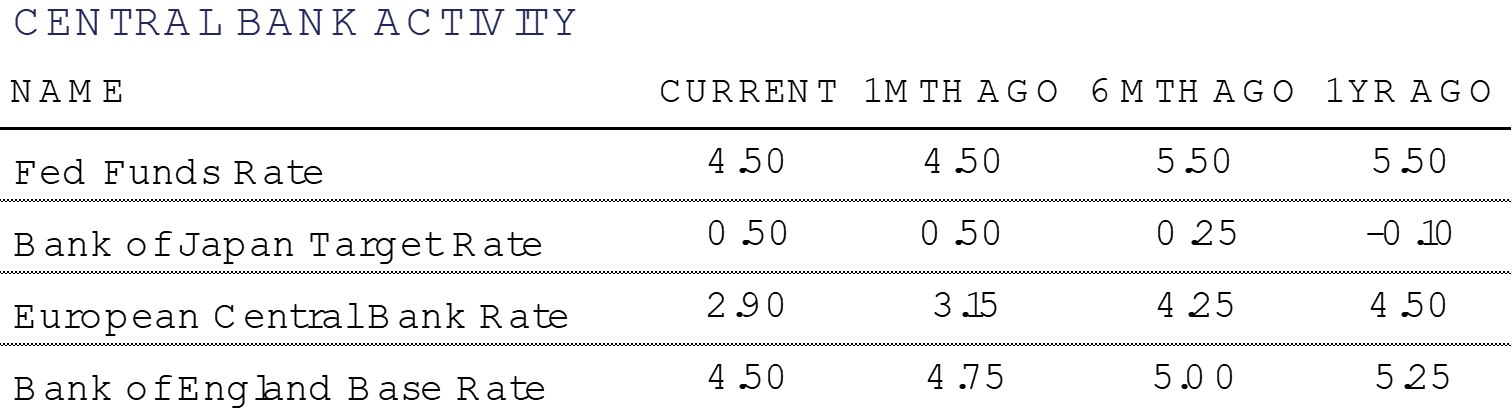
Switching gears to Europe, the European Central Bank (ECB) is likely to cut its key interest rate later this week. Inflation figures released in one of Europe’s largest economies, France, came in lower than expected, below last months inflation read, and the lowest level since February of 2021. French inflation has remained below the ECB’s 2% target for over half a year. Inflation seems to have stabilized in Spain, Italy, and Germany giving the ECB reason to cut for the sixth time since last summer. However, the risk remains that inflation could reverse course with looming US tariffs. President Trump announced 25% tariffs on European cars and “all the things” but with no clear timetable announced as we go to print.
Fixed Income
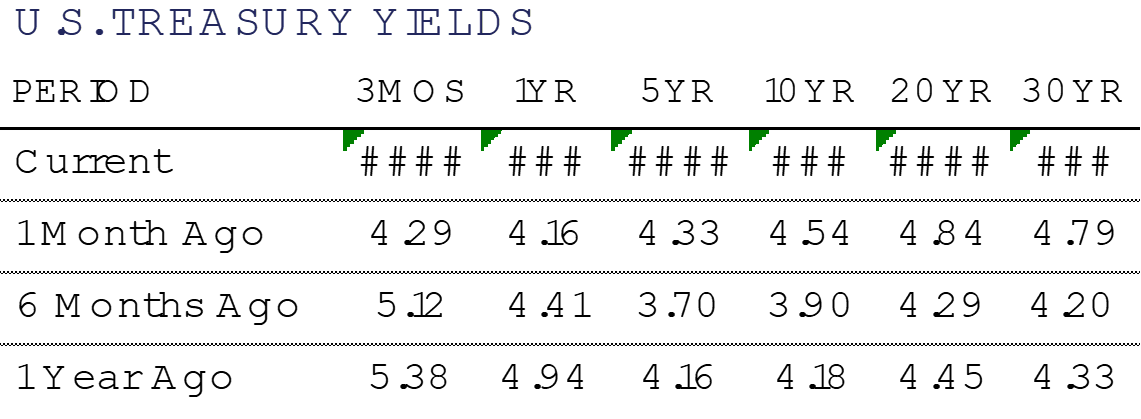
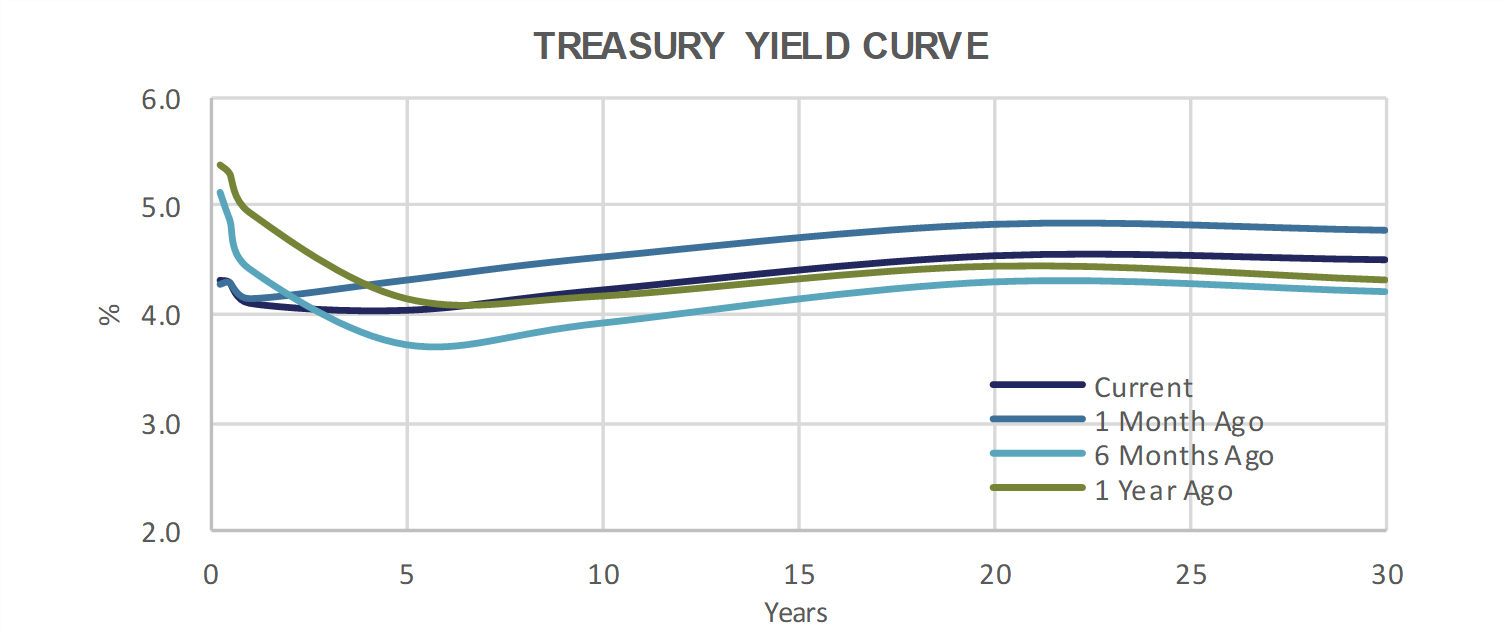
Yields have fallen by 50 bps or more across maturities longer than 24 months since the peak in 2025 yields on January 14th. This significant swing displays the high level of interest rate volatility that we have experienced in a very short period of time. Perhaps the more striking development is the retracement from a yield curve which had come very close to de-inverting, back to a 10-year Treasury yield that is significantly below that of the 3-month T-Bill.
The dramatic sentiment swings in the bond market since the end of Q3 2024 have placed fixed income investors on high alert, with recession calls beginning to regain momentum. While there are no flashing red-lights at this point, we are beginning to see some yellow-lights around the consumer and GDP growth expectations.
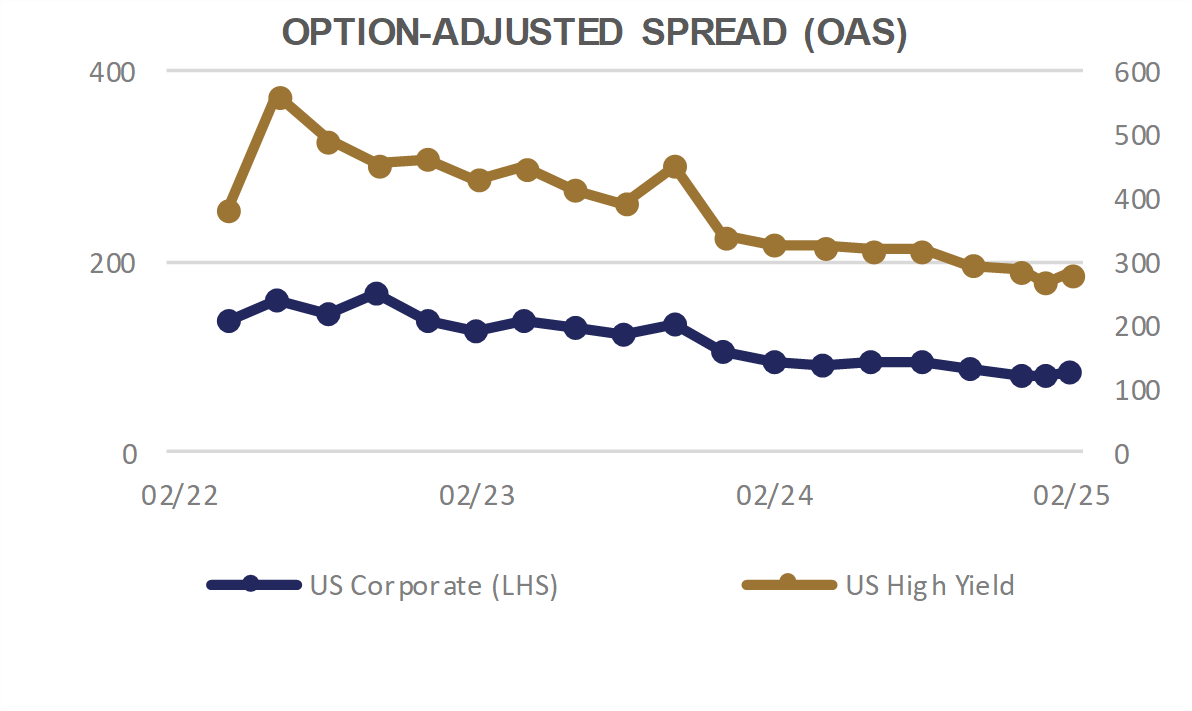
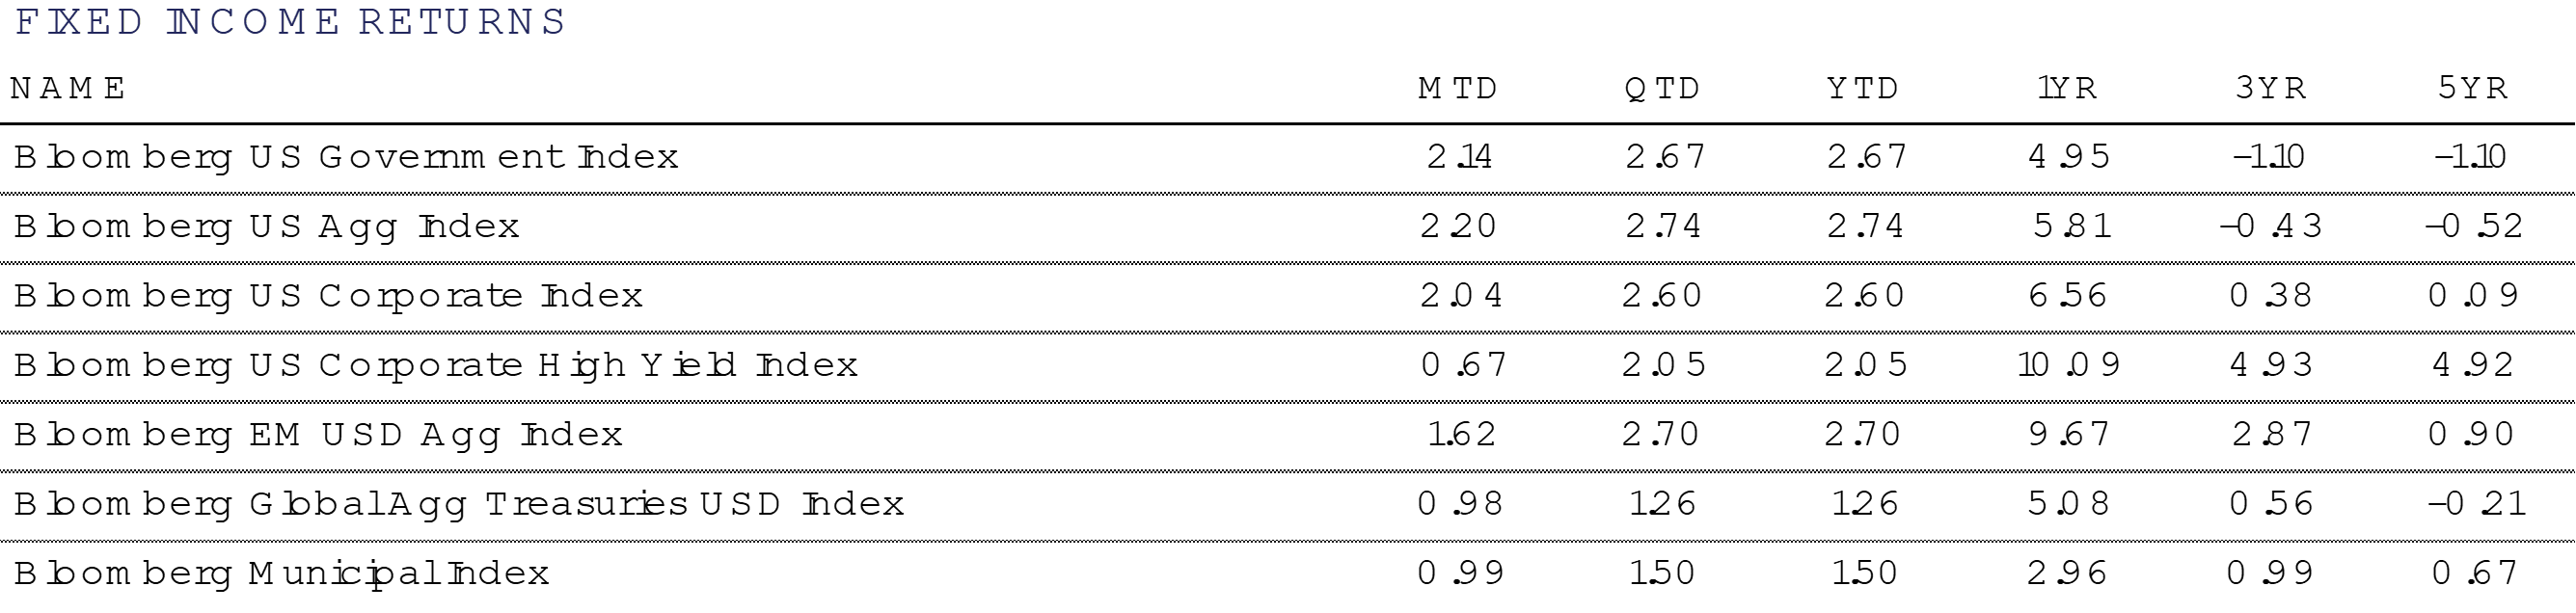
Investment Grade (IG) corporate bonds faced some slight credit spread widening, focused at the end of February. This was a minor headwind, resulting in a slightly lower monthly return than they would have otherwise produced. Even so, the coupon income and price rise due to falling yields resulted in an attractive monthly return of 2.0%.
High Yield (HY) corporate bonds experienced a more pronounced case of credit spread widening, and benefitted less from falling interest rates due to their shorter Duration. This resulted in High Yield bonds putting up the least attractive return number for the month. Year to date, HY also now trails the investment grade indices. Over longer time frames, though, taking risk in fixed income has paid off, with HY leading in performance over 1, 3, and 5 years.
Tax-free Municipal bonds cheapened vs. Treasury bonds during February, as Muni bond prices rose more slowly than similar maturity Treasury bonds. This does not make tax-free bonds look cheap on a historical basis, but it does get them closer to fair value. There is much being discussed by the Federal government that will influence the future of tax-free municipal bonds. The potential of income tax cuts makes munis less attractive, and can cause their prices to decline. There is also talk of ending the ability of municipalities to issue tax-free bonds, which could create a rarity value and increase prices.
Alternative Investments
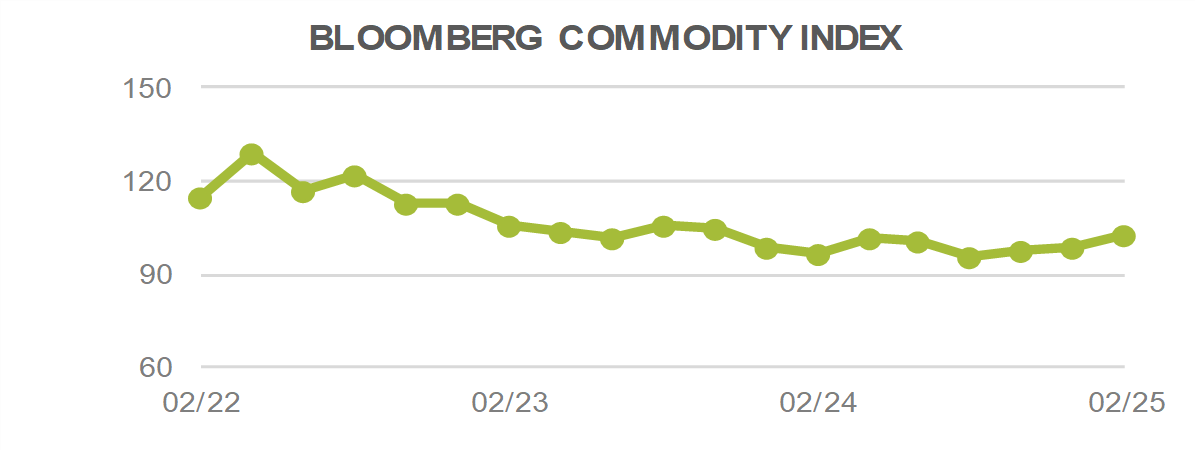
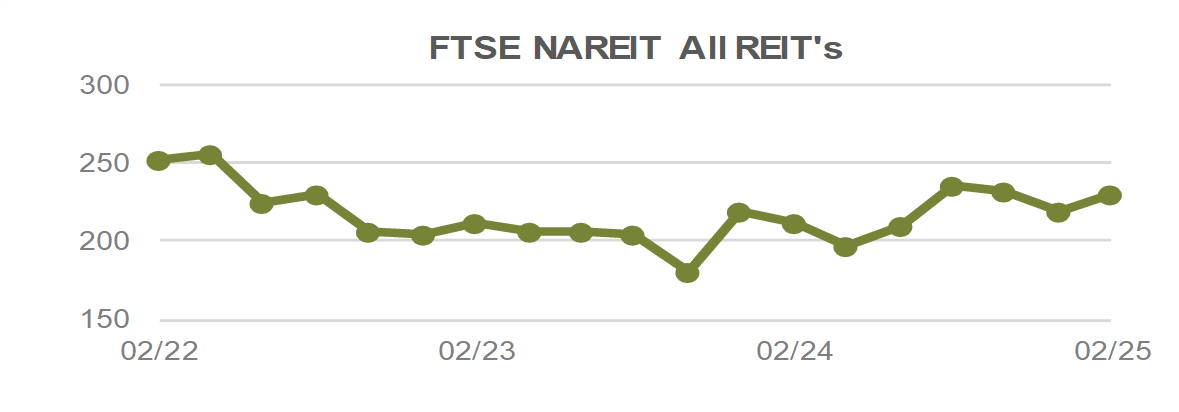
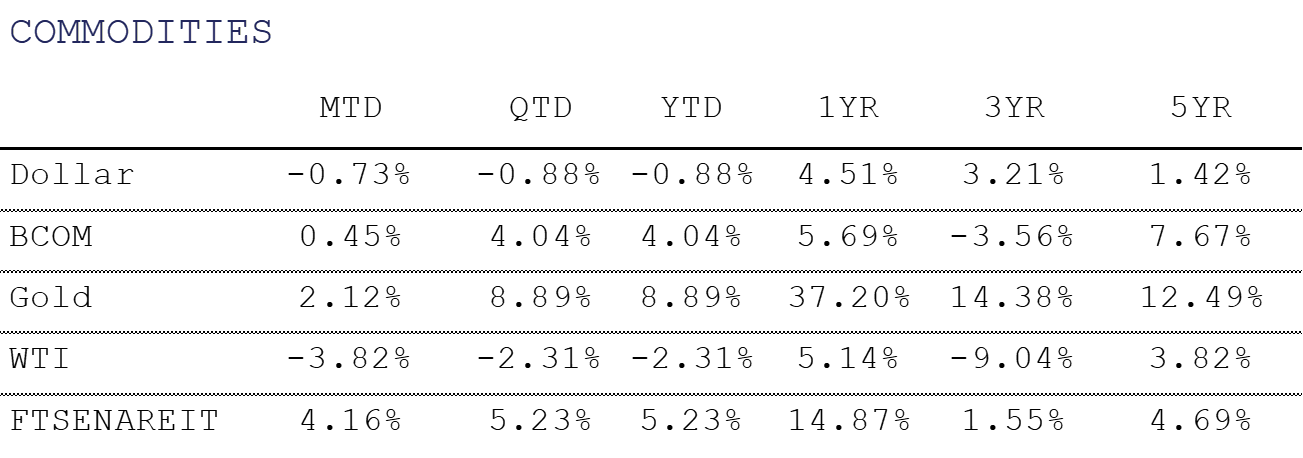
Alternative investments had mixed results in February, as the Bloomberg Commodity Index returned +0.5% for the month. Real Estate, was one of the best performing alternative assets during the time as lower interest rates contributed to the FTSE NAREIT Index returning +4.2%.
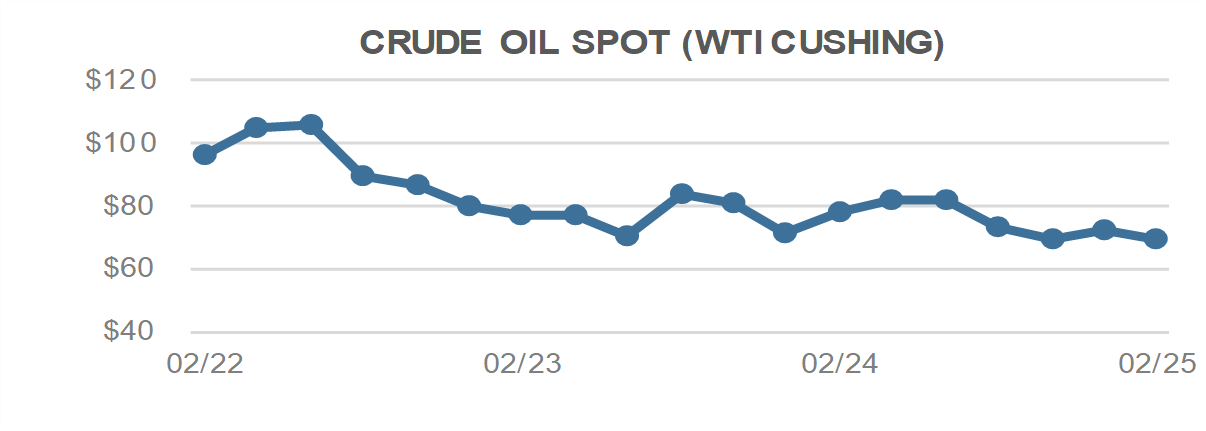
WTI Crude Oil fell -3.8% during the month to close at $69.76 per barrel. Geopolitical issues and an uncertain tariff landscape has caused volatility in commodity markets, particularly in oil. Canada and Mexico are the two top foreign oil suppliers to the U.S., so tariffs can reduce trading volumes and raise the price. However, a trade war can potentially counteract the upward pressure by slowing economic growth and dampening oil demand, which could weigh on prices. Also complicating the landscape is uncertainty around a Ukraine peace deal and upbeat manufacturing activity in February in China, helping raise hope for fuel demand in the top crude importer.
Cryptocurrencies have showcased their volatile nature to start 2025, as Bitcoin has fallen from a high around $109,000 on inauguration day to below $80,000 at one point in late February. The sell-off was partially driven by a dip in high beta assets due to macro concerns and the largest hack ever in crypto markets as almost $1.5 Billion in assets was stolen off the Bybit exchange on February 21st.
Crypto enthusiasts were initially hopeful that a more crypto friendly U.S. government and SEC dropping multiple cases against crypto units at companies such as Coinbase and Robinhood would be supportive of prices. However, certain policies, including the announcement of a Crypto Strategic reserve of potentially 5 assets, have been met with skepticism.

For more news, information, and strategy, visit the ETF Strategist Channel.
Disclosure Information