
Economic Overview
April’s economic data suggested a slowdown in the U.S. economy is underway, although one marked by “full employment”, a generally healthy consumer, and somewhat sticky inflation. The odds of ‘higher for longer” with regard to short-term interest rates have risen, as has the probability of some sort of soft landing, as opposed to a deep recession.
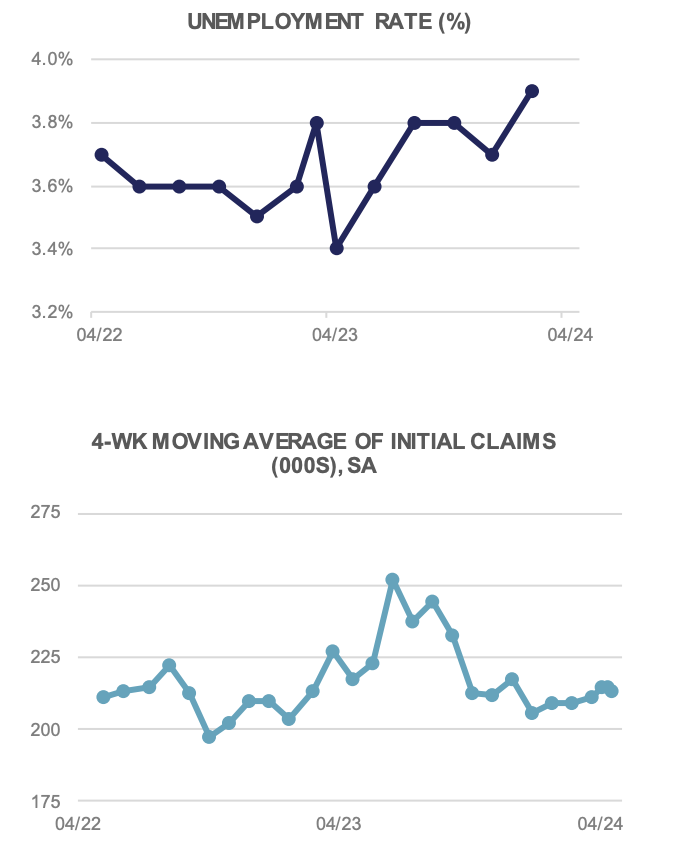
The Unemployment Rate in March came in as expected at 3.8%, down slightly from the prior month, while weekly Initial Jobless Claims held steady around 210k. The JOLTS data for March saw a decline in Job Openings from 8.7 million to 8.5 million. Average Hourly Earnings rose +0.3% in March, and are up 4.1% YoY. The Labor Force Participation Rate edged up +0.2% to 62.7%.
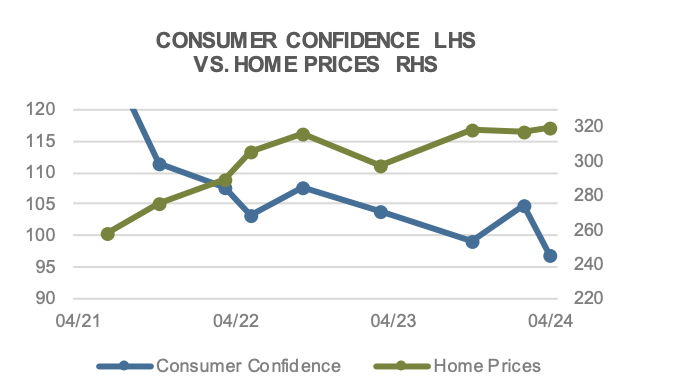
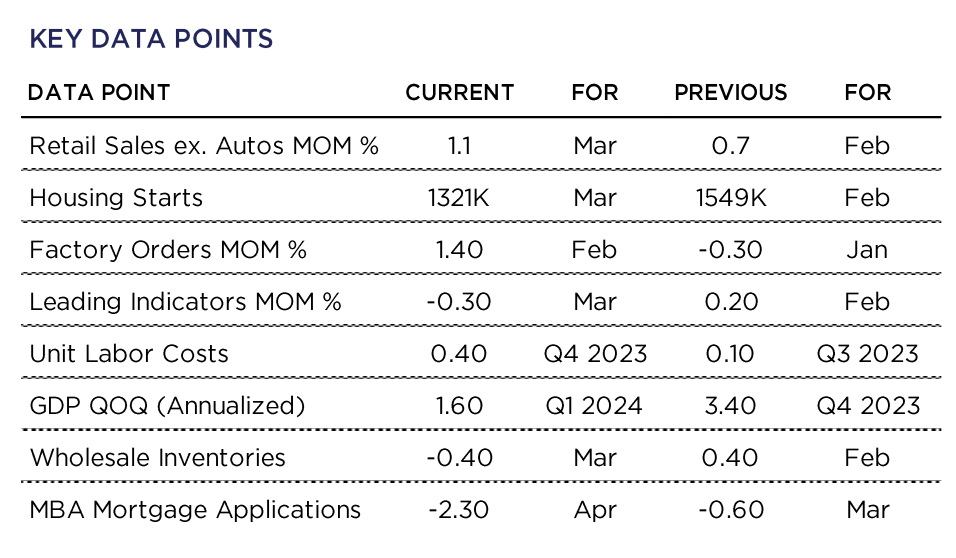
At the consumer level, Personal Incomes rose +0.5% in March, while Personal Spending edged up +0.8%, more than expected. Retail Sales advance a higher-than-forecast +1.1% on the month. The April U of Michigan Sentiment Index fell slightly MoM to 77.2, while the Conference Board’s Consumer Confidence survey missed expectations, coming in at 97.0.
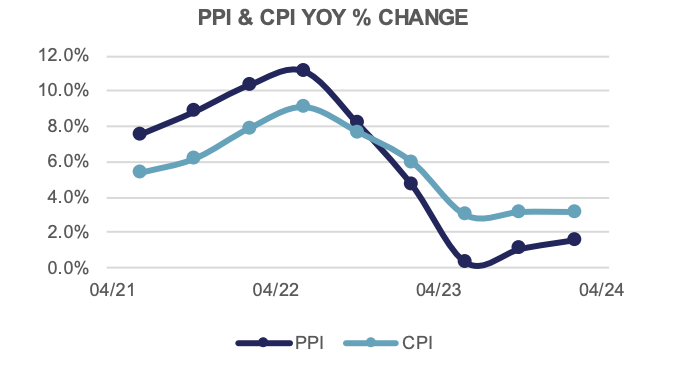
Persistent inflation remains the challenge for the Fed and markets alike. The Consumer Price Index rose +0.4% in March, for a +3.5% YoY increase. Ex Food & Energy, prices rose +0.4% MoM and +3.8% YoY. At the wholesale level, price gains were more moderate, with the Producer Price Index rising +0.2% MoM and +2.1% YoY, while Core PPI gained +0.2% MoM and +2.4% YoY. The Fed’s preferred measure, the PCE Deflator, rose +0.3% in March, and is up +2.7% YoY.
The latest FOMC confab concludes today and it’s widely expected they will leave short-term interest rates unchanged. The market will be watching for signals that rate cuts are on the horizon; however the data thus far suggest a longer-term pause is more likely. Volatility has picked up as investors recalibrate when that first rate cut may be.
Domestic Equity
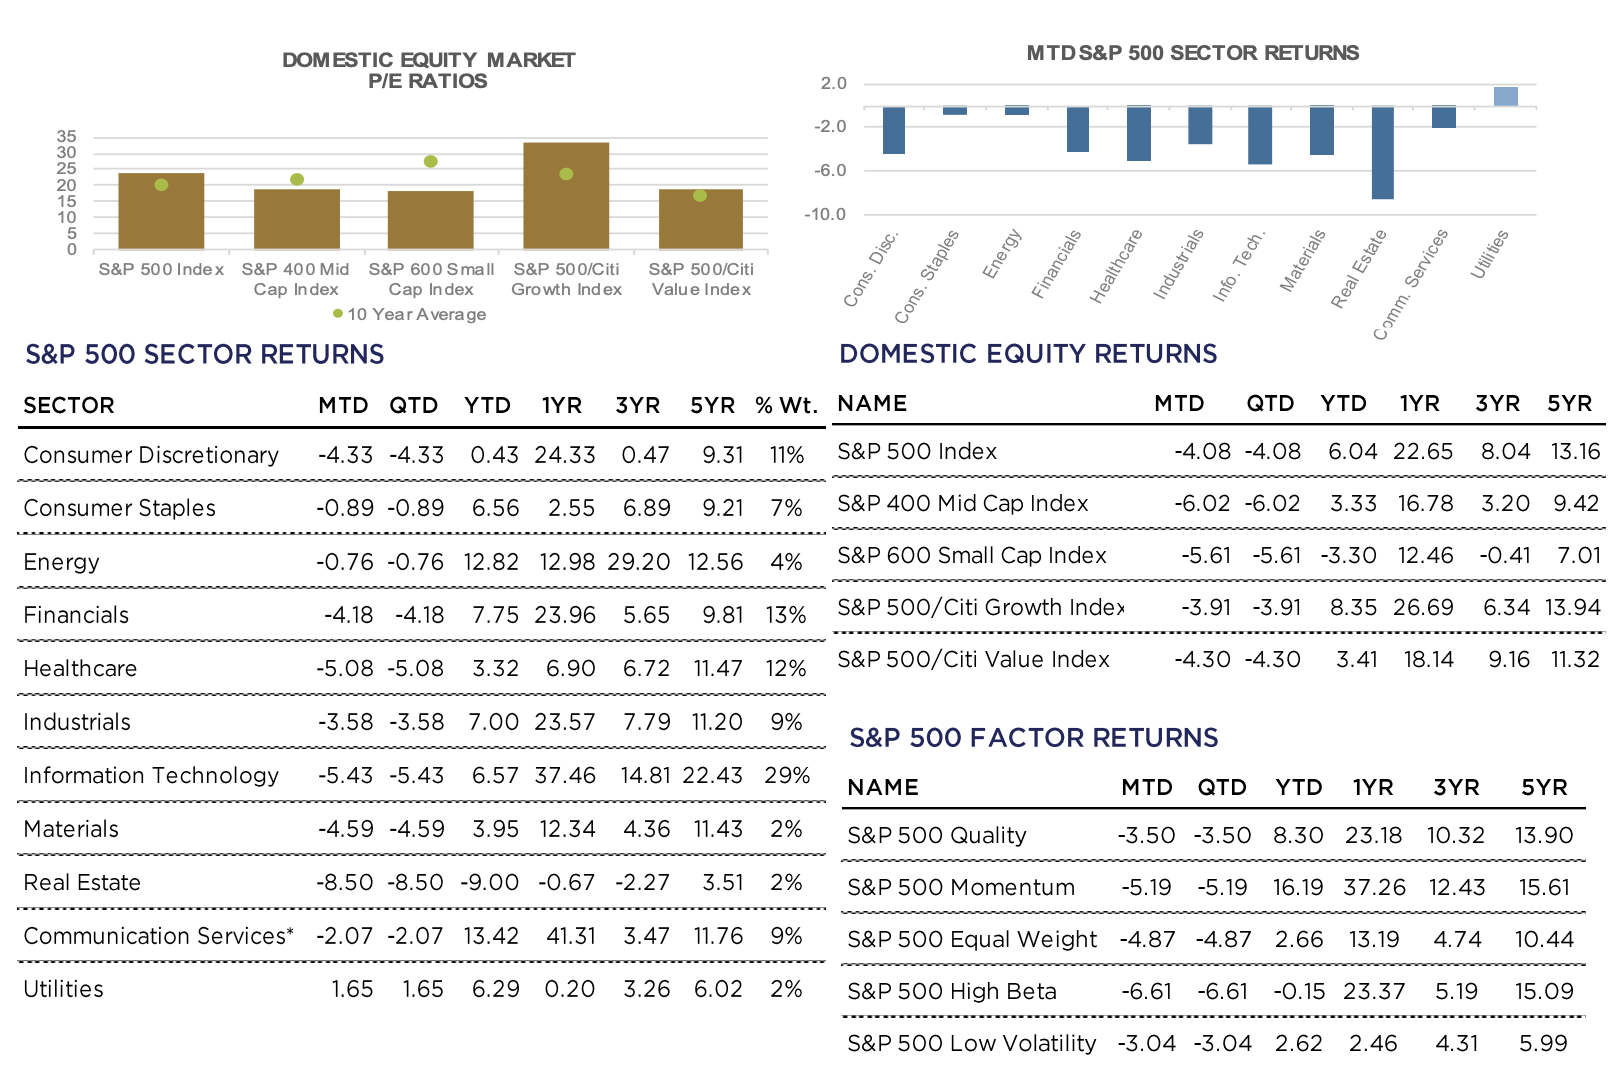
US equities pared their YTD gains in April, as the benchmark S&P 500 Index shed -4.1% to close at 5,036. For the year, Large-Caps remain in positive territory with gains of more than +6.0%. Mid- and Small-Caps, as measured by the S&P 400 and 600 Indices, also gave back gains, falling -6.0% and -5.6%, respectively. For the year, Mid-Caps have returned +3.3%, while Small-Caps remain in the red, with a -3.3% return.
Growth outperformed Value during the month by nearly 40bps on the back of better than expected earnings from many of the Mega-Caps. Magnificent 7 companies were mixed, with Alphabet (Google) and Tesla rising sharply post-earnings, while Microsoft and Meta (Facebook) didn’t fare as well. Earnings from Amazon came in after the bell on April 30, and were largely greeted with excitement. Investors await Apple earnings on Thursday, and Nvidia’s results later in May for a fuller picture on two of the worlds largest companies.
Beyond just the Magnificent 7, earnings reports from key companies in the Artificial Intelligence (AI) ecosystem were also mixed, with investors scrutinizing plans for future capital expenditures and revenue generation coming from AI, amongst others. It’s clear thus far that investor expectations are high, and meaningful AI revenue generation remains elusive or in the distant future for most.
At the sector level, strength in April came from traditionally defensive corners of the market, namely Utilities, which gained +1.65%, and Consumer Staples, which lost -0.9%. From a factor standpoint, the combination of Quality and Low Volatility outperformed at the margin, returning -3.0% and -3.5%, respectively. Weakness was most acute in rate sensitive sectors such as Real Estate, which returned -8.50%, and Technology, which lost -5.4%. Factors most exposed to Technology and AI also underperformed, with the S&P 500 High Beta and Momentum Indices losing -6.6% and -5.2%, respectively during the month.
International Equity
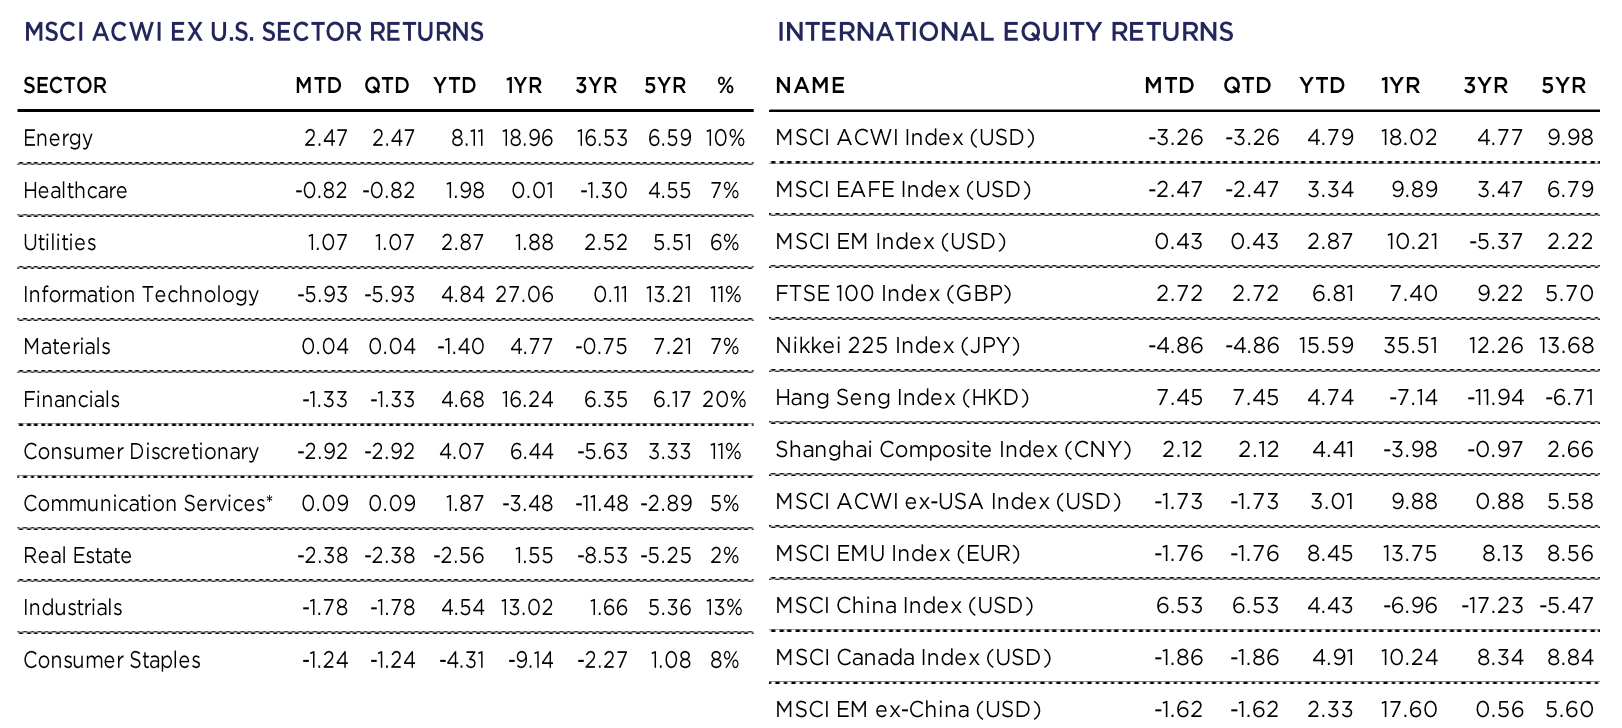
International equities broadly performed poorly during the month of April, albeit outperforming US equities. Developed Markets (DM), as measured by the MSCI EAFE Index (USD) fell -2.5% while Emerging Markets (EM), as measured by the MSCI EM Index (USD) gained a mere +0.4%. The outperformance in Emerging Markets came on the back of strong performance out of China, with the MSCI China Index (USD) gaining +6.5%.
Chinese investors became optimistic from the news that first quarter Gross Domestic Product grew +5.3% from the year prior. This GDP number showed growth to be faster than expected and gave Chinese officials some reprieve as they look to maintain growth which has struggled since the pandemic. Chinese investors have also recently benefited from share buybacks and increased dividends from some of the country’s larger companies.
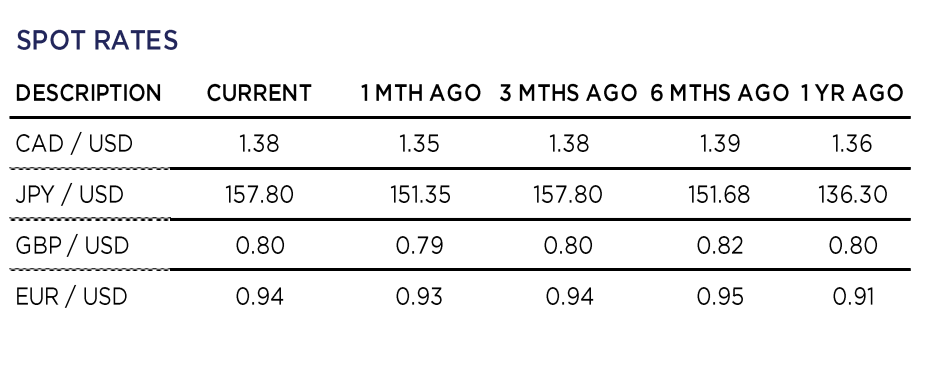
The story out of Japan has mainly been dominated by historic weakness in Yen relative to the US Dollar. The Yen briefly touched 160 to the USD at the end of the month before slightly strengthening to 157.6 as we go to print. Bank of Japan Governor Kazuo Ueda noted that the weakening currency was a risk factor and that confidence to raise interest rates again later this year was increasing. On the month, the Nikkei 225 Index fell -4.9% in Japanese Yen terms and a staggering -8.6% in US Dollar terms. Year to date, the Index still boasts strong returns of +15.6% JPY.
Shares in Europe broadly fell during the month of April, as the MSCI EMU Index (EUR) fell -1.8%, with most strategists attributing the performance to an overall weakening market both abroad and in the US. However, there was some fresh economic data points that gave Europeans some relief. Eurozone Composite PMI came in at 51.4, up from 50.3 in March. Readings above 50 indicate expansionary environments. UK PMI rose to 54.0, up from 52.8 in March.
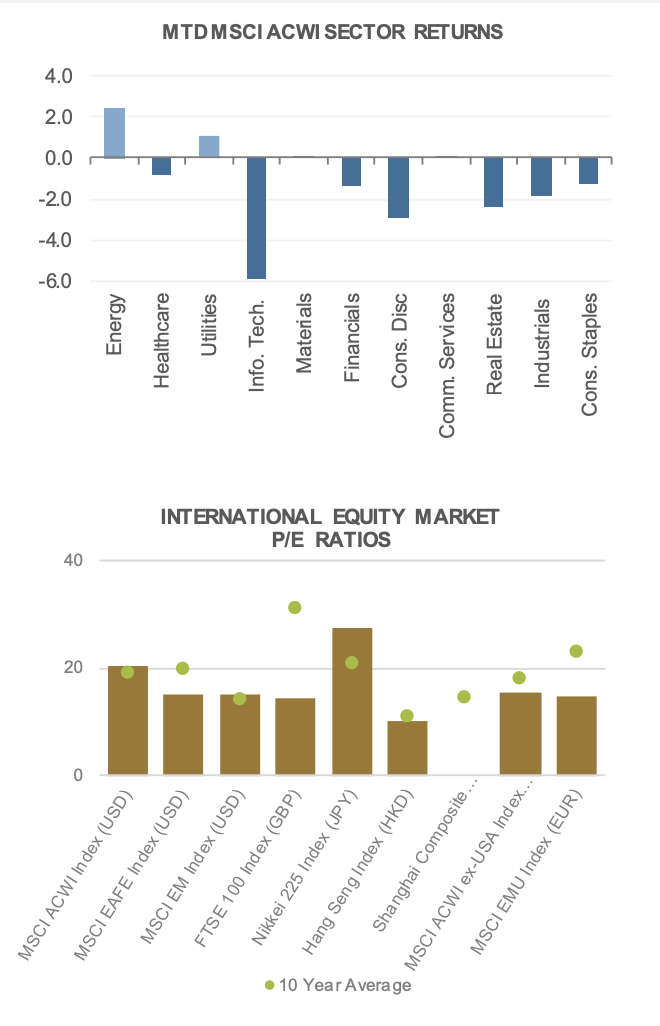
Seven of the eleven MSCI ACWI ex-US sectors posted negative returns on the month, with Information Technology posting the steepest loss of -5.9%. The energy sector posted the strongest return of +2.5%, followed by Utilities’ +1.0% gain, representing an overall defensive positioning during the month of April.
Fixed Income
The Federal Reserve will conclude its meeting this afternoon and provide some guidance on how they are thinking about the less supportive inflation data that has been reported over the past few months. A single data point that does not support the widely anticipated rate cuts can be dismissed. A string of data that conflicts with expectations of continued progress in lowering inflation is something else entirely. There has to be a shift in the Fed’s tone. It is only a question of how meaningful the shift will be.
With multiple Fed speakers willing to entertain the possibility of a single rate cut this year, or perhaps none at all, Chairperson Powell will likely be less hawkish than he has been following the past few meetings.
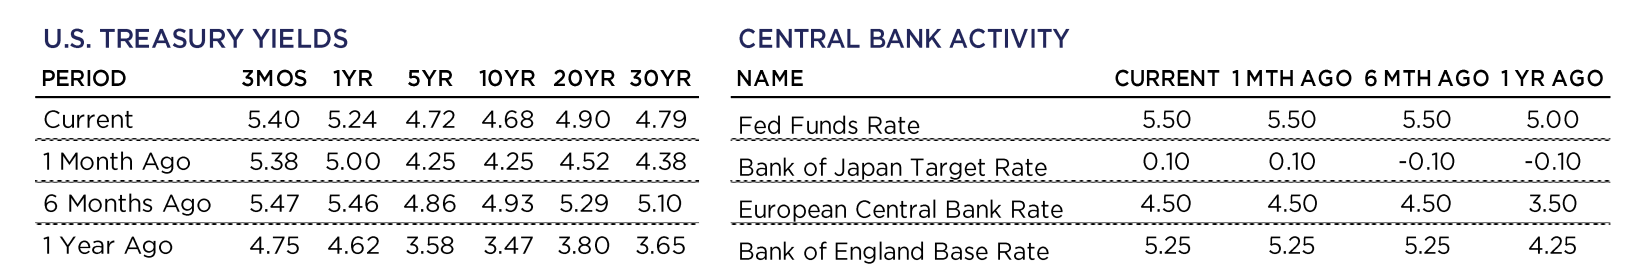
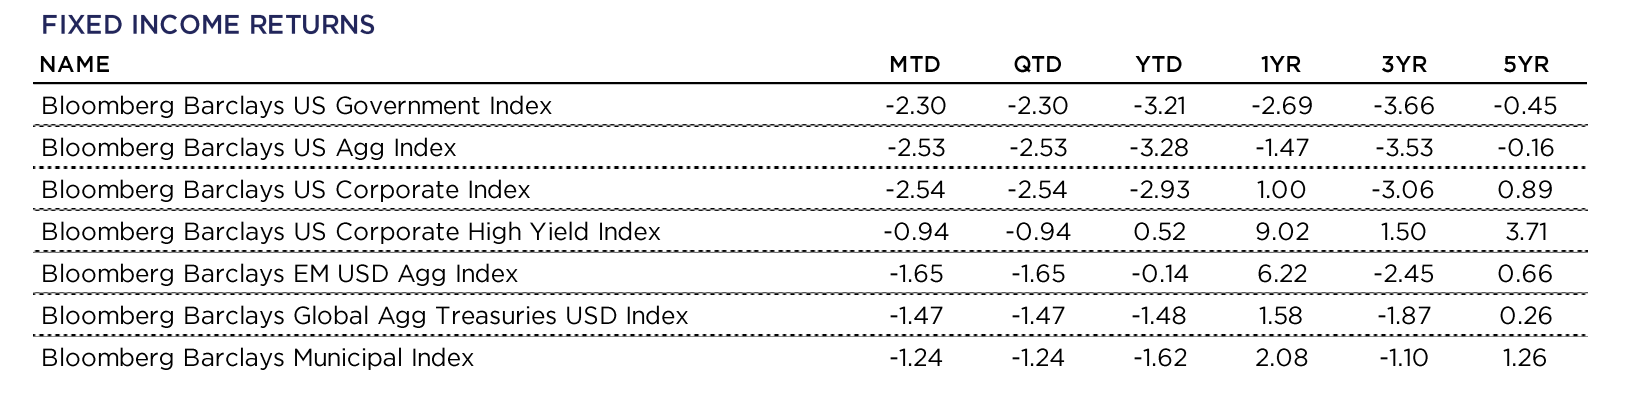
During the month of April, the yield curve shifted higher across almost all maturities. This created significant downward price pressure for fixed income broadly. With inflation readings consistently coming in higher than expected, the bond market has begun to price in a potential “higher for longer” scenario.
The Government index, the Aggregate Index, and the Investment Grade (IG) Corporate Index were down over 200 basis points in the month.
High Yield (HY) Corporate bonds were the star of the show, falling only 94 basis points. The high level of income earned in the month, combined with High Yield bonds relatively short Duration, limited the price drawdown due to interest rate fluctuations, and provided a tailwind in the month of April.
Tax-free municipal bonds were also a strong performer. They fell slightly more than High Yield, but outperformed the Investment Grade taxable bond indices by a wide margin.
Year-to-date results rhyme with what we have experienced in April. The top performing allocation has been HY Corporate bonds, followed by Tax-Free Municipal bonds. Investment Grade Corporate bonds are a distant third, as their longer average Duration has weighed down performance.

Alternative Investments
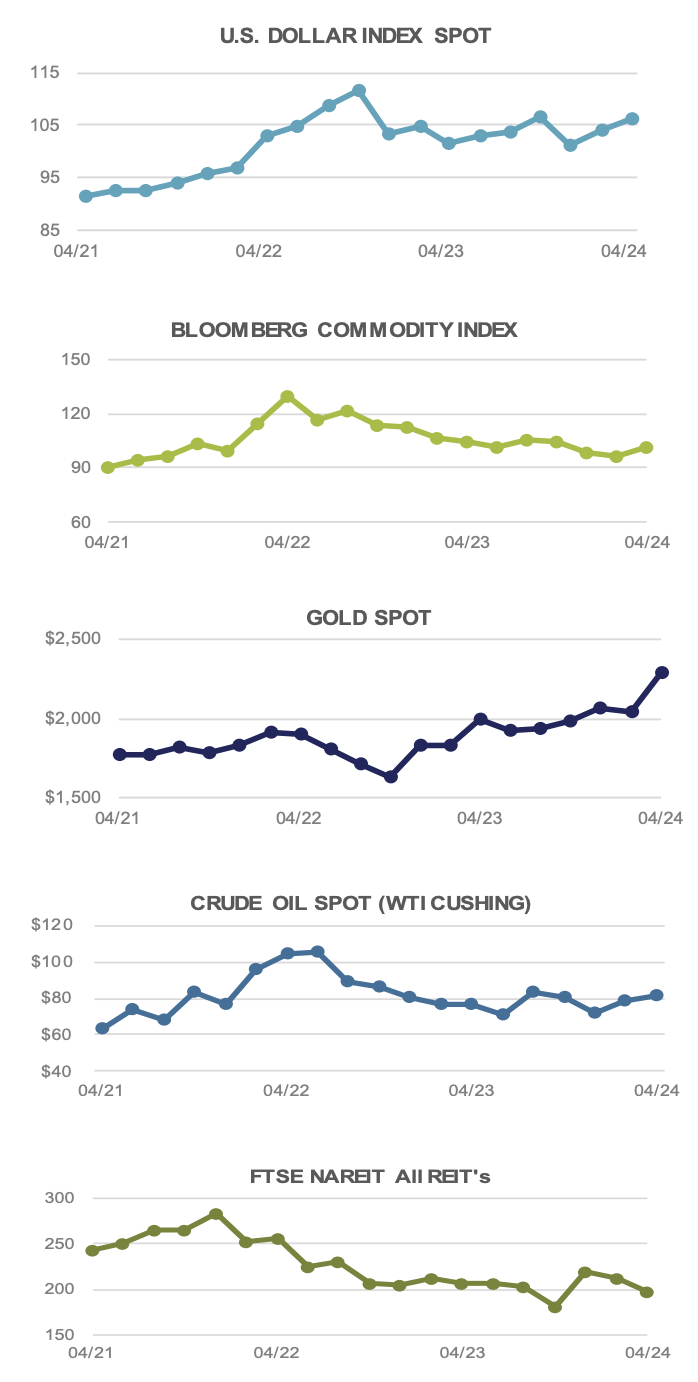
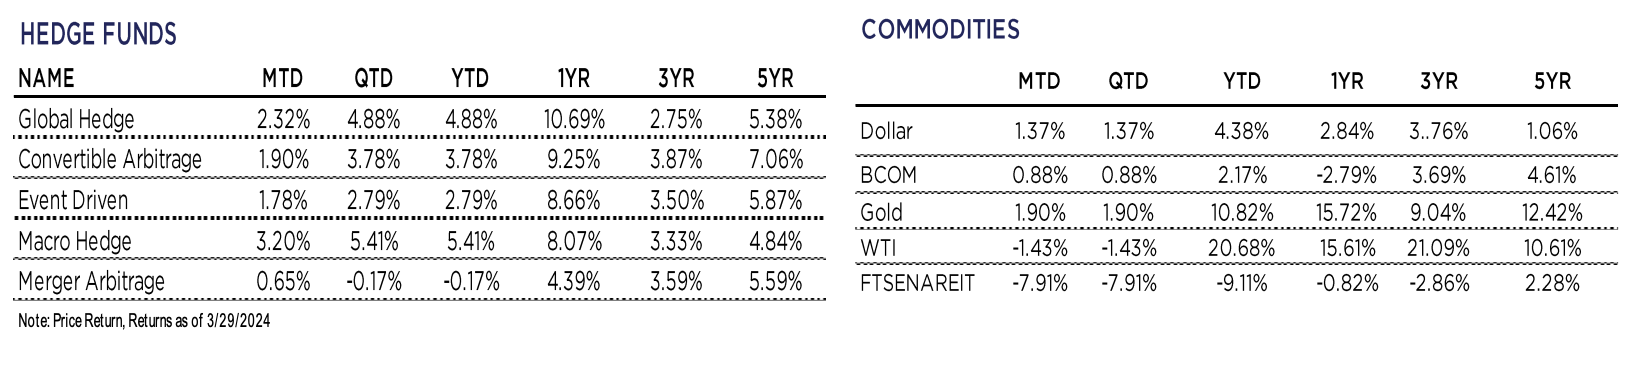
Alternative investments exhibited another positive month in April. Broad Commodities, as measured by the Bloomberg Commodity Index, were up +0.9% on the month, further fueling ongoing inflation concerns
Persistently high commodity prices make it difficult for central banks to cut interest rates. Commodities have a direct relationship to inflation, and despite a drop in the second half of 2022 and the first half of 2023, commodity prices have broadly remained the same over the last three quarters. Central banks are highly attentive to commodity price movements and have singled that rate cuts are on the table for the 2nd half of 2024; however, without commodity prices falling, inflation can still linger, making it more difficult for central banks to cut rates.
Additionally, conflict in the Middle East has created a wave of uncertainty around the price of Brent Crude, the international oil benchmark, as several key oil producers are directly or indirectly involved in the tension. Price risk not only stems from potential supply shocks but also from disruptions in trade routes. The Strait of Hormuz is a strait between the Persian Gulf and the Gulf of Oman that provides the only sea passage from the Persian Gulf to the open ocean and is a crucial bottleneck to global oil distribution. The World Bank estimates the average price of Brent could surge to over $100 per barrel (currently ~$88) given a severe disruption in the region. Conflict in the Middle East, in turn, could be a catalyst for increased global inflation.
Turning to precious metals, Gold continued its strong performance, increasing +1.9% during the month, propelling prices to near all-time highs around $2,300 an ounce. Lifted by China and geopolitical tensions more and more people flock to the commodity as a safe-haven asset. The Chinese economy has been slowed by an abysmal property market and slumping stock returns; thus, Chinese investors are allocating supplementary funds to Gold. As of quarter end, Chinese Gold bar consumption equates to about a third of global consumption according to a recent WSJ article. Gold can be a solid diversifier to a portfolio, as over long periods, returns are often negatively correlated with equities during periods of market stress.


For more news, information, and analysis, visit the ETF Strategist Channel.
