
It’s been a hot summer in New York City, and the markets have been red hot as well. Speculation abounds and a record portion of NYSE volume is now in stocks with prices under $5, portfolio betas are at or near all-time highs, and companies are being encouraged to jettison their business models to borrow to hoard crypto.
It’s always fun to return to classic novels for summer reading and accordingly, this year’s Charts for the Beach returns to the time-honored basics of the economy and of investing.
So, wiggle your toes in the sand, grab a beer or a Hugo spritz, and enjoy!
1. Don’t forget dividends!
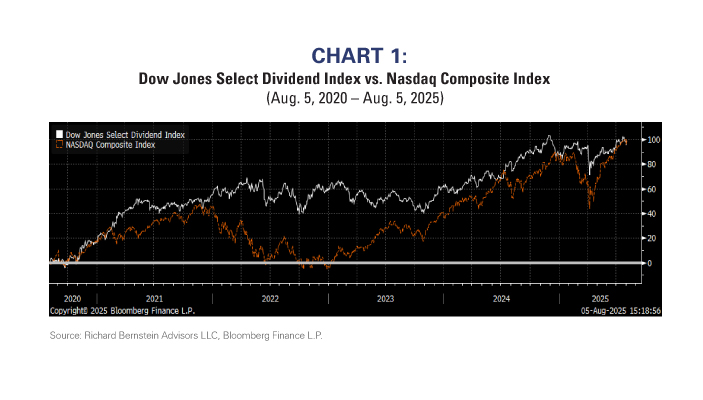
Dividends are a major part of our current portfolios because investors seem to forget the power of compounding dividends during heady times. Our first chart points out that the Dow Jones Select Dividend Index is – believe it or not – actually neck-and-neck with NASDAQ over the last five years.
The competition between the two indices is even more interesting because Technology comprises only about 4% of the dividend index, but Utilities, Financials, and Consumer Staples comprise nearly 2/3rd of the index.
2. Has stagflation arrived?
Some stagflation (i.e., stagnating growth with rising inflation) appears in every late-cycle environment simply because inflation is a lagging variable relative to growth. As the cycle ages, growth tends to slow but inflation doesn’t.
The current cycle is following that historical path. More importantly, though, it is the first time since prior to the Global Financial Crises that stagflation has appeared.
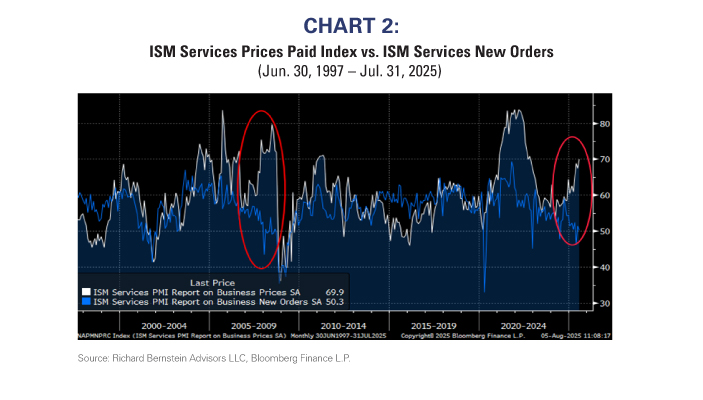
The following chart shows the ISM Services Prices Paid Index (a proxy for inflation) versus the ISM Services New Orders (a proxy for growth). One can see stagflation potentially forming for the first time in more than 15 years.
3. The Maseratis and the Blahniks are on sale
Every consumer purchase involves a value proposition. If one could purchase a Maserati for the price of a Chevy or a pair of Manolo Blahnik shoes for the price of Skechers, most consumers would certainly do so. In fact, they’d probably ask for two!
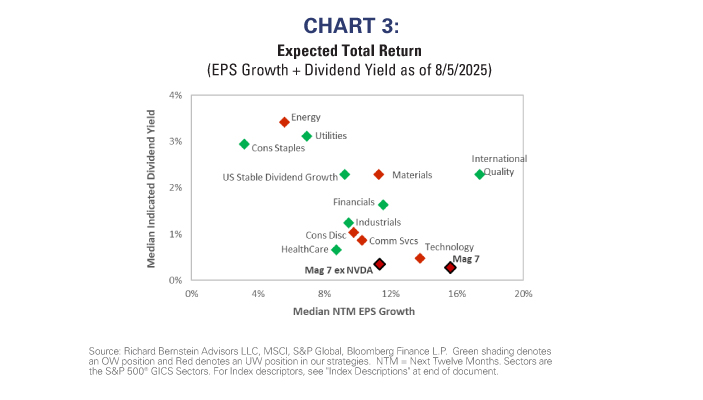
However, somehow people forget the value proposition when they buy stocks. Today, the Maseratis and the Blahniks are on sale.
Non-US high quality companies offer virtually the same earnings growth as the US’s Magnificent 7 stocks (17% vs. 16%), offers nearly 10 times the dividend yield (2.3% vs. 0.3%), and is valued at about a 35% discount.
4. Analysts won’t warn you if there’s a profits slowdown looming
Analyst estimates tend to follow performance. If stocks go up, then analysts tend to raise estimates. If stocks go down, then they tend to lower estimates.
The “Liberation Day” selloff prompted analysts to significantly cut their estimates when stocks fell. The subsequent rebound in the market then encouraged analysts to raise their estimates, and those upward revisions have fostered a new consensus that the profits cycle will accelerate. Contrary to that view, our forecast remains that profits are decelerating.
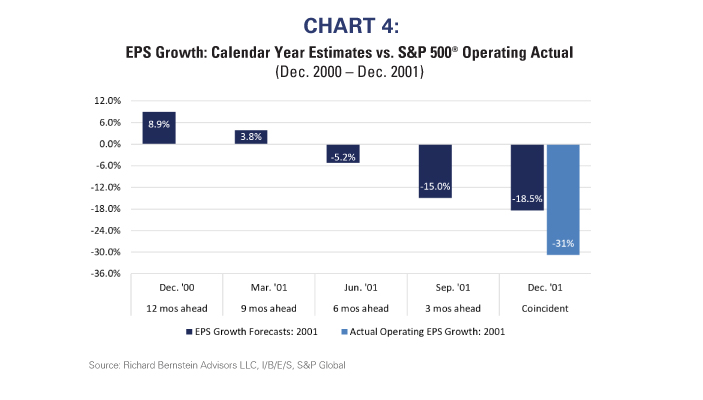
A look back at the Tech Bubble indicates it might not be prudent to follow estimate revisions during a speculative period. In December 2000, several quarters past the peak of that profits cycle, analysts were still forecasting nearly 9% earnings growth for 2001. They gradually lowered their growth forecasts, but never enough to account for the actual drop of 31%.
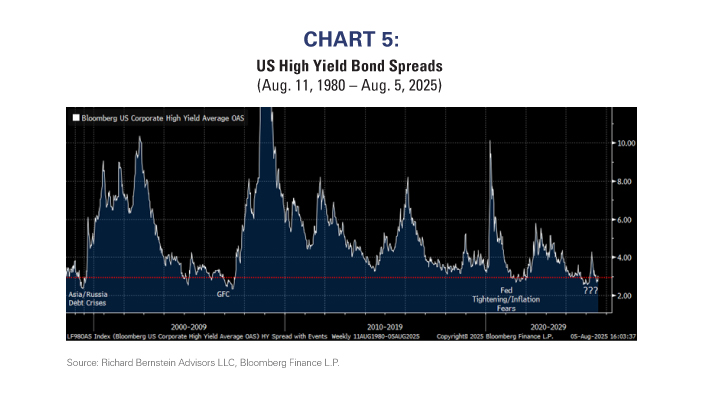
5. Not getting paid to take credit risk
Perhaps our most out-of-consensus position right now is that our fixed-income portfolios have virtually no credit exposure. Historically, the time to take credit risk is when credit spreads are abnormally wide and the profits cycle is troughing. Today, credit spreads are abnormally narrow and the profits cycle is peaking.
The next chart shows that today’s high yield bond spreads are similar to those prior to the Asia/Russia credit crises, the global financial crisis, and 2022’s inflation fears and Fed tightening. That suggests to us caution might currently be warranted toward credit especially within the context of profits decelerating.
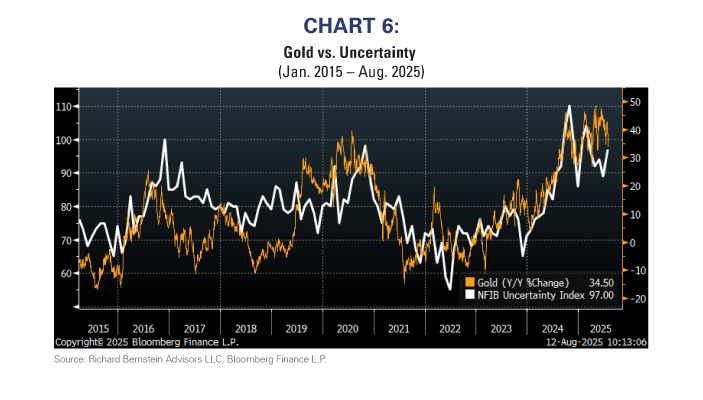
6. Gold as a ballast against uncertainty
Some investors like to trade gold, but we prefer to think in terms of an allocation to gold. We hold gold not to make short-term gains, but rather to act as a ballast against the unexpected.
There has historically been a relationship between gold returns and uncertainty. The chart below shows gold’s year/year returns versus the National Federation of Independent Businesses (NFIB) Uncertainty Index.
This explains a lot about gold’s recent returns, but also suggests that gold might not provide outsized returns should uncertainty subside.
To us, the only certainty in the markets is there will likely be continued uncertainty, and we are maintaining our gold allocations within our multi-asset portfolios.
For more news, information, and strategy, visit the ETF Strategist Content Hub.
INDEX DESCRIPTIONS:
The following descriptions, while believed to be accurate, are in some cases abbreviated versions of more detailed or comprehensive definitions available from the sponsors or originators of the respective indices. Anyone interested in such further details is free to consult each such sponsor’s or originator’s website.
The past performance of an index is not a guarantee of future results.
Each index reflects an unmanaged universe of securities without any deduction for advisory fees or other expenses that would reduce actual returns, as well as the reinvestment of all income and dividends. An actual investment in the securities included in the index would require an investor to incur transaction costs, which would lower the performance results. Indices are not actively managed and investors cannot invest directly in the indices.
Dow Jones Utility Average: The Dow Jones Utility Average Index is a price-weighted average of 15 utility companies that are listed on the New York Stock Exchange and are involved in the production of electrical energy. The average as it is known today began on January 2, 1929 with a base value of 50.
Dow Jones U.S. Dividend Index: Dow Jones U.S. Dividend 100 Total Return Index measures the stock performance of high dividend yielding U.S. companies with a record of consistently paying dividends, selected for fundamental strength relative to their peers, based on financial ratios. It is calculated in USD with dividends reinvested.
Nasdaq: The Nasdaq Composite Index: The NASDAQ Composite Index is a broad-based market-capitalization-weighted index of stocks that includes all domestic and international based common type stocks listed on The NASDAQ Stock Market.
Mag 7: The Magnificent 7 (Mag 7) are a group of 7 widely-traded companies classified in the United States and representing the Communications, Consumer Discretionary and Technology sectors as defined by the Global Industry Classification Standard (GICS®)
developed by MSCI Barra and Standard & Poor’s. These consist of AAPL, AMZN, GOOGL,
META, MSFT, NVDA and TSLA.
About Richard Bernstein Advisors
Richard Bernstein Advisors LLC is an investment manager focusing on long- only, global equity and asset allocation investment strategies. RBA runs ETF asset allocation SMA portfolios at leading wirehouses, independent broker/ dealers, TAMPS and on select RIA platforms. Additionally, RBA partners with several firms including Eaton Vance Corporation and First Trust Portfolios LP, and currently has $16.6 billion collectively under management and advisement as of June 30, 2025. RBA acts as sub‐advisor for the Eaton Vance RBA Equity Strategy Fund, the Eaton Vance RBA All‐Asset Strategy Fund and also offers income and unique theme‐oriented unit trusts through First Trust. RBA is also the index provider for the First Trust RBA American Industrial Renaissance® ETF. RBA’s investment insights as well as further information about the firm and products can be found at www.RBAdvisors.com.
Nothing contained herein constitutes tax, legal, insurance or investment advice, or the recommendation of or an offer to sell, or the solicitation of an offer to buy or invest in any investment product, vehicle, service or instrument. Such an offer or solicitation may only be made by delivery to a prospective investor of formal offering materials, including subscription or account documents or forms, which include detailed discussions of the terms of the respective product, vehicle, service or instrument, including the principal risk factors that might impact such a purchase or investment, and which should be reviewed carefully
by any such investor before making the decision to invest. RBA information may include statements concerning financial market trends and/or individual stocks, and are based on current market conditions, which will fluctuate and may be superseded by subsequent market events or for other reasons. Historic market trends are not reliable indicators of actual future market behavior or future performance of any particular investment which may differ materially, and should not be relied upon as such. The investment strategy and broad themes discussed herein may be inappropriate for investors depending on their specific investment objectives and financial situation. Information contained in the material has been obtained from sources believed to be reliable, but not guaranteed. You should note that the materials are provided “as
is” without any express or implied warranties. Past performance is not a guarantee of future results.
All investments involve a degree of risk, including the risk of loss. No part of RBA’s materials may be
reproduced in any form, or referred to in any other publication, without express written permission from RBA. Links to appearances and articles by employees of Richard Bernstein Advisors, whether in the press, on television or otherwise, are provided for informational purposes only and in no way should be considered a recommendation of any particular investment product, vehicle, service or instrument or the rendering of investment advice, which must always be evaluated by
a prospective investor in consultation with his or her own financial adviser and in light of his or her own circumstances, including the investor’s investment horizon, appetite for risk, and ability to withstand a potential loss of some or all of an investment’s value. Graphs, charts, and tables are provided for illustrative purposes only. Investing is subject to market risks. Investors acknowledge and accept the potential loss of some or all of an investment’s value. Views represented are subject to change at the sole discretion of Richard Bernstein Advisors LLC. Richard Bernstein Advisors LLC does not undertake to advise you of any changes in the views expressed herein.
© Copyright 2025 Richard Bernstein Advisors LLC. All rights reserved. PAST PERFORMANCE IS NO GUARANTEE OF FUTURE RESULTS
