
While geopolitical volatility in the Middle East has captured the headlines and stoked market anxiety, a more profound and constructive narrative is quietly unfolding within the domestic economy. For the disciplined investor, the noise of the news cycle often obscures a broadening opportunity set. We are currently witnessing a resurgence in the American industrial sector and a structural shift in productivity that suggests the U.S. is entering a growth cycle reminiscent of the 1990s.
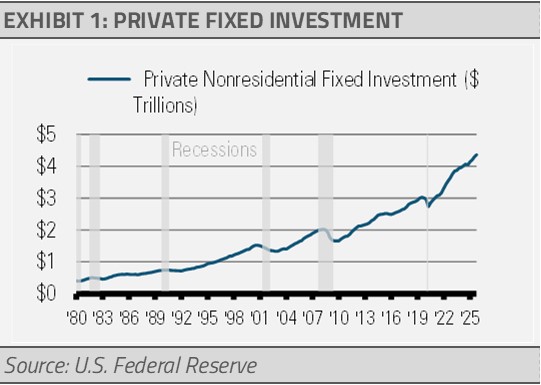
The cornerstone of our optimistic outlook is the recent boom in business investments in plant, equipment, and research and development (R&D) spending, known as private fixed investment (exhibit 1). Historically, significant capital investment in infrastructure at these levels precedes long-term gains in efficiency. We are now seeing these productivity gains manifest in the data (exhibit 2).
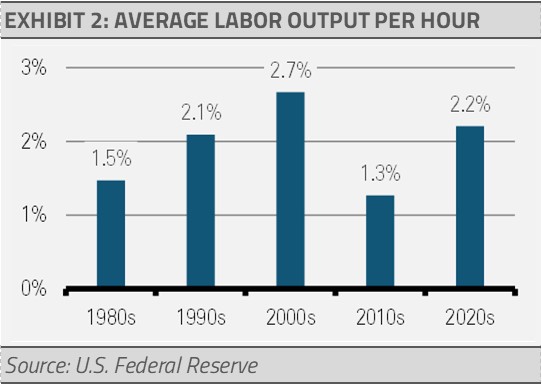
This acceleration in output per hour is critical and allows for faster economic growth and rising per-capita income without the typical inflationary pressures associated with a tight labor market. Similar to the information revolution of the 1990s, the current massive investments in artificial intelligence (AI) and industrial automation are creating a foundation for sustained, non-inflationary expansion.
In addition, the One Big Beautiful Bill Act (OBBBA) is set to be a growth engine for 2026 by providing two immediate catalysts:
- Corporate Resilience: By restoring immediate R&D expensing, the act provides a $100 billion corporate windfall, directly supporting profit margins.
- Consumer Support: The expected injection of $150 billion in incremental tax refunds between February and May acts as a stimulus for consumer spending.
This fiscal support explains why the National Retail Federation (NRF) projects sales growth above the 3.6% pre-pandemic average even as household budgets face headwinds from higher energy prices.
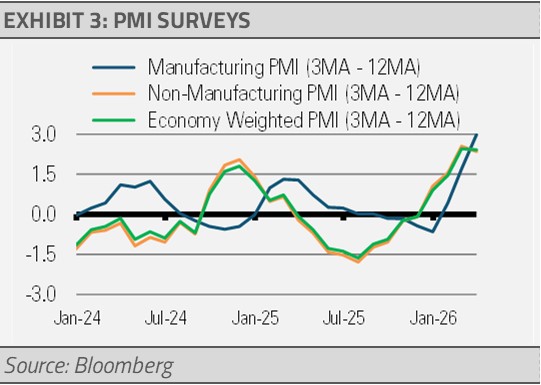
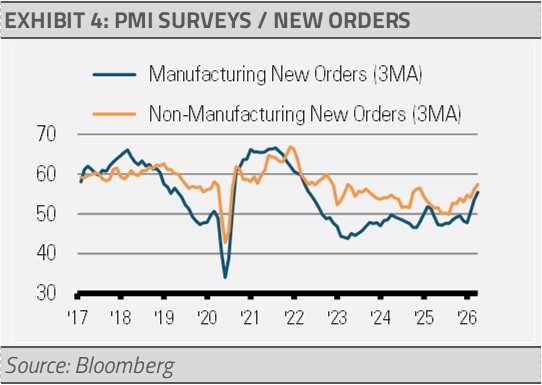
Despite a moderation in the service sector, our Recession Tracker methodology identifies industrial production as the strongest pillar of the U.S. economy. Manufacturing business surveys, such as the Purchasing Manager Index (exhibit 3), are trending upward. This positive trend is led by a significant jump in new orders (exhibit 4), which is a reliable leading indicator of future economic activity.
This industrial re-shoring and modernization effort differentiates the U.S. from European and Asian markets, which remain more vulnerable to disruptions stemming from the conflict in the Middle East.
INVESTMENT IMPLICATIONS
The recent high correlation between equities and fixed income has been a source of frustration and echoes the difficult environment of 2022. However, we expect this correlation to fade as inflation stabilizes and the market refocuses on realized earnings growth.
- Equities: We remain overweight domestic allocations. The disparity in global resilience reinforces our decision to remain underweight international equities, which face greater structural dependencies on imported energy and fertilizers. Our favored sectors include industrials, financial services (especially regional banks), energy, and materials.
- Fixed Income: While higher long-term rates have pressured prices, they have simultaneously improved valuations. High-quality bonds offer a compelling total return profile and more attractive yields than we have seen in years.
- Alternatives: We continue to integrate alternative strategies to provide diversified sources of return that are less sensitive to interest rate swings. We continue to emphasize equity option overlay strategies for increased current income as well as a multi-sector real return strategy for lower correlation total returns and risk mitigation.
The path forward will likely include bouts of volatility. However, with healthy private sector finances, a revitalized industrial core, and a historic surge in productivity-enhancing investment, the backdrop for the disciplined investor is strong.
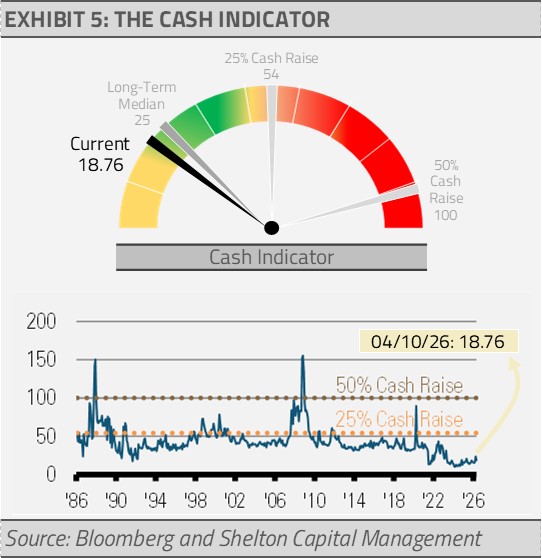
THE CASH INDICATOR
The Cash Indicator (CI) continues to provide reassurance for investors who are more sensitive to market volatility. By providing a reliable tool to contextualize volatility, the CI can help avoid the behavioral mistakes that often derail investors during periods of higher volatility like these.
The CI has elevated to reflect geopolitical and financial market uncertainties. However, the current level has only risen closer to the long-term median level. Increased equity market volatility has largely been offset by relatively steady credit spreads. As things stand, the CI does not suggest an impending market dislocation. As a result, we think that investors should use market volatility to add to high quality positions.
For more news, information, and analysis, visit the ETF Strategist Content Hub.
DISCLOSURES
Shelton Capital Management is an investment adviser in Denver, CO. Shelton Capital Management is registered with the Securities and Exchange Commission (SEC). Registration of an investment adviser does not imply any specific level of skill or training and does not constitute an endorsement of the firm by the Commission. Shelton Capital Management only transacts business in states in which it is properly registered or is excluded or exempted from registration. Some of the firm’s strategies allocate client’s investment management assets among exchange-traded funds (“ETFs”). A GIPS Report along with a complete list and description of all composites is available by calling (800) 955-9988. A copy of Shelton Capital Management’s current written disclosure brochure filed with the SEC which discusses among other things, Shelton Capital Management’s business practices, services and fees, is available through the SEC’s website at: www.adviserinfo.sec.gov. INVESTMENTS ARE NOT FDIC INSURED OR BANK GUARANTEED AND MAY LOSE VALUE. The views contained herein are not be taken as an advice or a recommendation to buy or sell any investment and the material should not be relied upon as containing sufficient information to support an investment decision. It should be noted that the value of investments and the income from them may fluctuate in accordance with market conditions and taxation agreements and investors may not get back the full amount invested.
Past performance and yield may not be a reliable guide to future performance. Current performance may be higher or lower than the performance quoted. The securities identified and described may not represent all of the securities purchased, sold or recommended for client accounts. The reader should not assume that an investment in the securities identified was or will be profitable.
Data is provided by various sources and prepared by Shelton Capital Management and has not been verified or audited by an independent accountant.
