
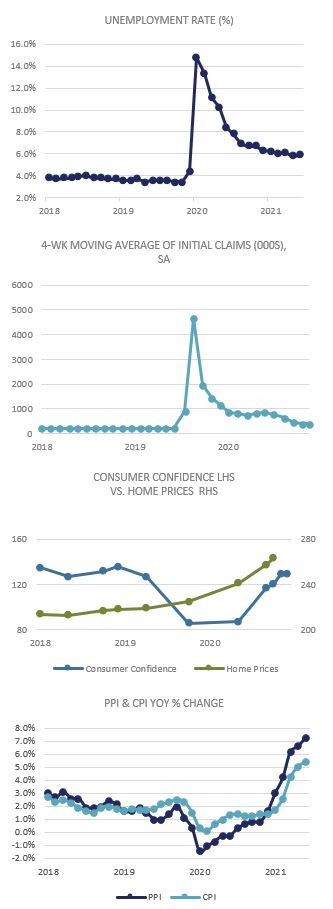
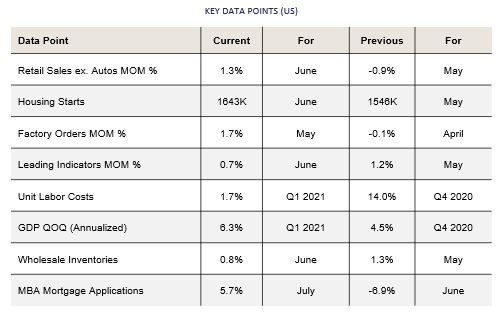
 On the surface, the US economy continued to hum along in July, with the Advance Estimate of Q2 GDP coming in at a +6.5% annualized rate. Q1 GDP was revised lower, to +6.3% from +6.4%. Under the surface, economic data as a whole has been missing expectations for months. The Citi US Economic Surprise Index hit a low of -19.00 on 7/29, the lowest reading in 2021 so far. Inflation continues to come in hot, and consumers are likely beginning to feel the pinch if they were not already. The headline reading of June’s Consumer Price Index (CPI) was up +5.4% Y/Y, ahead of May’s +5.0 Y/Y gain and April’s +4.2% Y/Y reading. The personal savings rate came in at 10.9% in Q2, down from 20.8% in Q1, indicating consumers are out spending again. Retail Sales ex Auto rose +1.3% M/M in June, up from -0.9% M/M in May, which beat expectations.
The housing market continued to accelerate, with the S&P Case Shiller 20 City Index rising +16.6% Y/Y in May, accelerating from April’s +14.8% reading. May’s growth rate is the highest on record. According to the National Association of Realtors, the median existing-home sale price hit $363,300 in June, another record. Fueled by low-interest rates and a huge supply and demand imbalance, homes are being snapped up in 17 days, with only 2.6 months of supply on hand.
Despite price increases everywhere, the Fed remains confident that inflation will be transitory. At their latest meeting, the Federal Open Market Committee (FOMC) left interest rates unchanged, with eyes now focusing on Jackson Hole at the end of the month. While many investors may wish the Fed would hike rates already, Powell and the FOMC likely have as much cover as they wish given the rising caseloads of the delta variant, mixed economic signals, and plenty of work to do (according to the Fed) on the labor market. It appears the “new” consensus maybe for the Fed to remain on hold through Jackson Hole, given that “substantial” further progress on the employment side is likely in the distance, and all the Fed appears to be concerned with at the moment. Stay tuned.
Domestic Equity
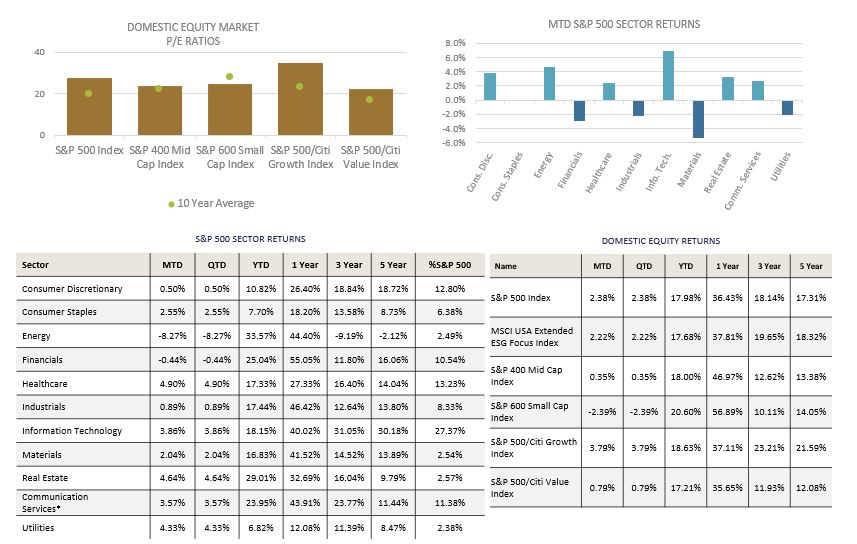
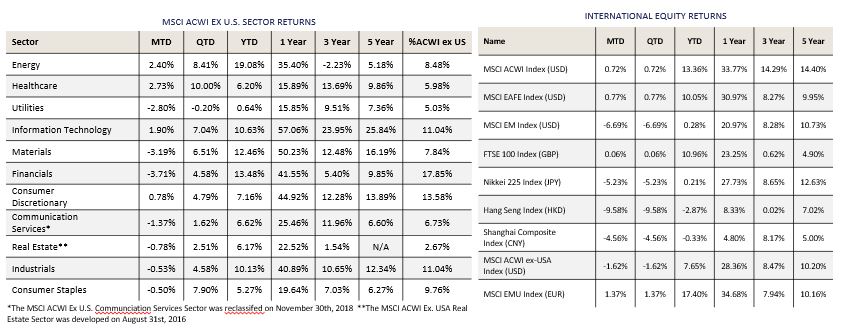
US Equities posted their sixth straight month of gains as the benchmark S&P 500 Index rose +2.4% on the month to close at 4,395, up +18.0% on the year. Mid- and Small-Caps, as measured by the S&P 400 and 600 Indices didn’t fare as well, posting monthly returns of +0.4% and -2.4%. For the year, Mid- and Small-Caps have returned +18.0% and +20.6%, respectively. After sprinting out of the gate to start the year, Small- and Mid-Caps have stalled in recent months, as US economic data has broadly missed expectations. The Citi US Economic Surprise Index hit a 1-yr low at -19.00 near the end of July (readings below zero signal economic data missing expectations). With SMID caps also being levered to the domestic economy, slowing economic data and a resurgence of COVID-19 cases may put a lid on near term performance, despite attractive valuations; however, should the “reflation trade” pick up steam heading into year-end, SMID caps may once again stand to benefit.
From a style standpoint, Growth again trounced Value as interest rates moved lower. The S&P 500 Growth Index returned +3.8% in July, compared to only +0.8% for the S&P 500 Value Index. Technology (Apple, Microsoft) and Communication Services (Google, Facebook) outperformed the broad market during the month, gaining +3.9% and +3.6%, respectively, as Big Tech posted record sales and earnings. Consumer Discretionary (Amazon) was a notable underperformer, returning only +0.5% on the month as Amazon widely missed earnings expectations as the economy continued to re-open and consumers went elsewhere with their marginal dollars.
Despite Value’s underperformance on the month, Defensive and Value-oriented sectors such as HealthCare, Real Estate, and Utilities outperformed, gaining +4.9%, +4.6%, and +4.3%, respectively. HealthCare, a notable laggard during the first half of the year, closed the gap with the broad market slightly but has still underperformed year to date. Real Estate continues to exhibit strong momentum, benefitting from re-opening and a renewed interest in inflation protection, returning +29.0% year to date. Industrial REITs have benefitted tremendously as surging demand for e-commerce warehousing has outstripped supply. Leasing spreads continue to increase substantially, however, the surge in performance has left valuations looking slightly expensive. Financials and Energy were notable underperformers, giving back -0.4% and -8.3%, respectively, but remain year to date outperformers by a wide margin.
International Equity
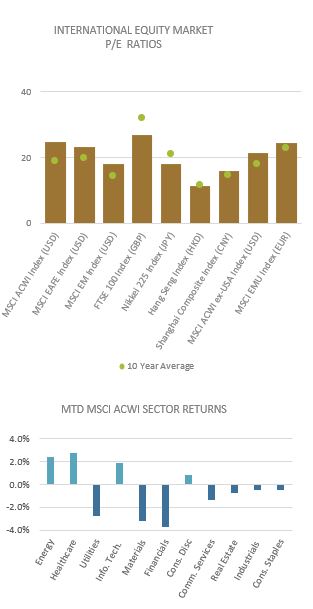 International Equities were a mixed bag in July with the MSCI ACWI ex USA Index returning -1.6%. More specifically, Developed Markets (DM), as measured by the MSCI EAFE Index, rose +0.7%. Eurozone equities, as measured by the MSCI EMU Index, rose +1.4% in EUR terms, while UK equities were essentially flat. Emerging Markets (EM), as measured by the MSCI EM Index, lost -6.7%. Emerging Markets were caught in the Chinese regulatory crosshairs in July, as crackdowns against major Technology companies roiled markets. China has always been fraught with political risk; however, the recent actions add a new level of uncertainty as the government wields the power to “wipe out” any industry or company on a given day. For example, new rules in the previously for-profit education space will transform an entire industry into a “not-for-profit.” While that sector is relatively small in the grand scheme of things, it underscores the heightened sense of uncertainty blanketing the entire Technology sector.
With Technology representing more than 40% of the MSCI China Index, and with China representing nearly 40% of the MSCI EM Index, the ramifications of these risks put investors in China, and EM for that matter, in a challenging position (i.e. time horizon). In the short-term (i.e. 6-12 months), it remains unclear what other sectors or industries may be the next to be targeted. The Chinese Securities Regulatory Commission (CSRC) sought to reassure investors in the wake of the selloff, asking investors not to “over-interpret” their latest actions. In the short-term, investors are likely to interpret the current environment as tactically unattractive; however, with the world’s second-largest economy and burgeoning middle class, China remains a long-term opportunity – so long as companies can make a profit, and investors have clarity on an appropriate discount rate to compensate for increased levels of risk.
The selloff in Chinese Technology companies spilled over into other parts of China and Asia more broadly, with the Shanghai Composite shedding -4.6% in CNY terms, Japan (Nikkei 225) losing -5.2% in JPY terms, and Hong Kong (Hang Seng) losing -9.6% in HKD terms. While the impact of recent events in China is the main culprit, it shouldn’t go without mention that Asia has its issues to contend with, mainly slowing economic data in China, low comparative vaccination rates in Japan (25-30% estimates), and social unrest in Hong Kong. These clouds shroud most of EM, as Asia accounts for the lion’s share of the MSCI EM benchmark. We will continue to monitor and communicate on any new developments.
Fixed Income
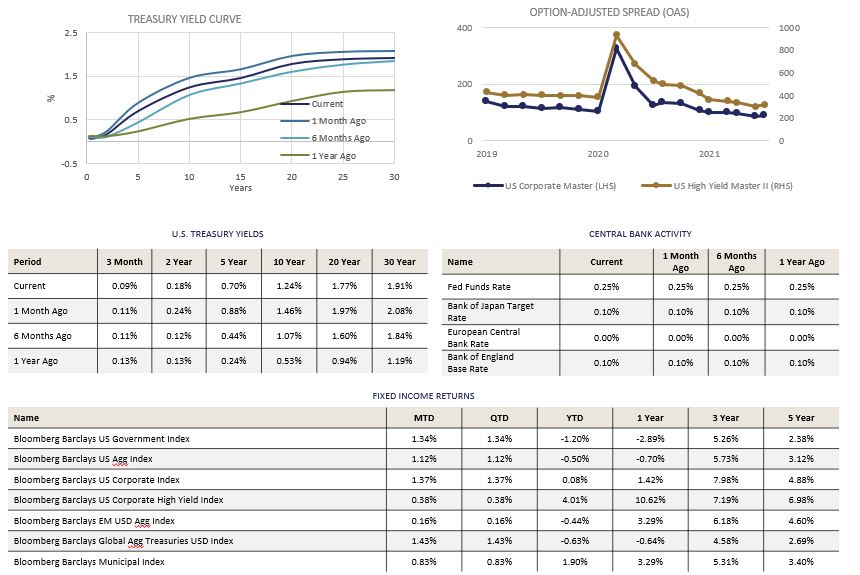
Jerome Powell’s Federal Reserve met last week. While it was acknowledged that the economy has been moving in the right direction, Powell made it clear that he would like to see further progress before removing monetary accommodation. Further detail is expected coming out of the Fed’s annual Jackson Hole conference in August.
Treasury bond yields moved lower during the month, even as inflation continued to push higher. The move appears to signal the market’s belief that the Fed is right about inflation (transitory) but wrong about how soon they can remove accommodation, which will slow the economy prematurely, causing rates to fall.
Investment Grade corporate bonds performed well, even with some spread widening in July. The additional yield provided by owning Investment Grade bonds remains near historic lows, even after the recent move. With this month’s performance, Investment Grade has clawed its way back to breakeven for the year.
Spread widening in the High Yield bond market was more pronounced than what was experienced in Investment Grade. The additional widening had a negative impact on the monthly performance for High Yield corporate bonds, which trailed Investment Grade by almost 100 basis points. While High Yield spreads remain tight historically, they currently offer the most value since Q1 2021. High Yield performance for 2021 continues to lead the way by a wide margin, even with the spread headwind experienced in July.
Municipal bonds remain sought after for their tax-free income. Valuations of longer maturity muni bonds relative to Treasury bonds held steady in July, while shorter maturities (inside of 5 years) became significantly more expensive. Municipal bond returns for 2021 have been very strong, second only to High Yield corporate bonds.
Alternative Investments
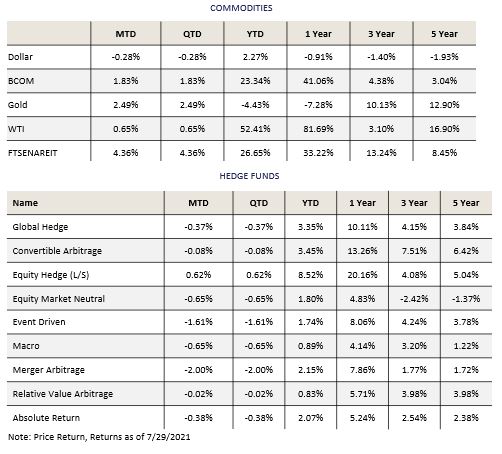
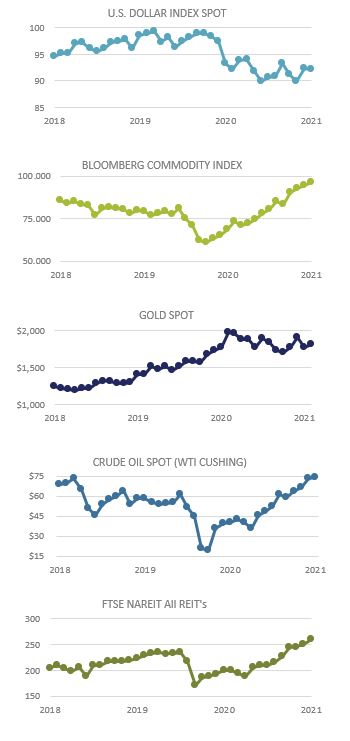 Alternative Investments were mainly positive in July, helped by a weaker dollar and continued risk-on sentiment. The US Dollar, as measured by the DXY Index, fell -0.28% during the month but is up +2.27% YTD.
Extreme weather across the US and other parts of the world also played a factor in certain production input prices rising. Flooding in Europe, droughts in South America, forest fires in North America, and high temperatures all affected various commodity markets. Raging forest fires in the US West reduced output for lumber and caused prices to climb after several months of the market cooling off. Lumber prices finished the month at $621.20 per thousand board feet, up from the lows of $490.70 hit intra-month, but remain down over 60% from its highs in May.
Liquefied natural gas (LNG) also saw price increases in July, finishing the month up +7.23%. The extreme temperature this summer has caused high domestic cooling needs and LNG export demand also remains strong.
WTI Crude Oil ended the month at $73.95 per barrel, up +52.41% for the year. The intra-month daily closing price of $75.25 on 7/13 was the highest closing price oil has reached since 2018. Concerns about the Coronavirus Delta variant could limit demand from climbing much higher, but the market still appears tight from a supply/demand perspective.
Hedge fund strategies were mostly negative during the month, with only one out of nine strategies tracked posting positive results. Equity Hedge (L/S) was the one positive performer and is also the best performing strategy so far this year, up +8.52% YTD.

ESG
 The European Union proposed the world’s first Carbon border-tax adjustment on certain imports from countries that do not levy their own Carbon tax. The border tax is expected to be phased in by 2026. While the news has so far received a frosty reception from European trading partners, it should encourage greater adoption of Carbon pricing schemes around the world, and a more efficient path to lower Carbon intensity worldwide. If a country exporting goods to the European Union does not have a home country Carbon tax, the EU will tax the goods when imported, receiving tax revenue that the home country forwent. Self-interest should provide a strong incentive for countries to keep that tax revenue at home.
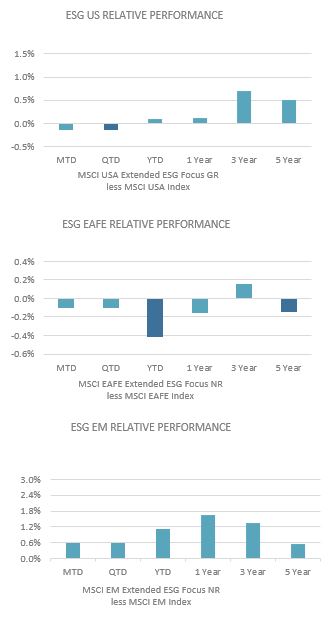
The ESG aligned U.S. index lagged slightly compared to the non-ESG integrated counterpart. Year-to-Date and all longer time periods continue to show strong outperformance. Short-term deviations are to be expected and do not weaken the support for ESG integration over longer time horizons.
ESG integrated EAFE returns continue to show a less impressive track record than its U.S. and EM counterparts. While the track record is mixed, it is hard to believe that an investment strategy that disregards ESG related information in the investment process will provide superior returns over time, particularly as the European Union continues to press ahead with its climate and ESG related goals, such as the Carbon Border adjustment implementation.
Emerging Market ESG integrated returns posted another gain vs. the non-ESG integrated benchmark in July. ESG integration continues to be additive to performance across all time periods in EM. This intuitively makes sense as the Emerging Markets should be the least informationally efficient, so any insight that can be gleamed from additional Environmental, Social, or Governance related information should be extremely helpful in the investment evaluation process.
Investment Grade corporate bonds have continued to post outperformance through ESG integration. The ESG integrated fixed income exposure returns are directionally similar, but add performance during each time period. While there will likely come a time when the strategy lags its non-ESG benchmark, the track record is strongly supportive of the value provided by ESG integration in fixed income.
Nottingham Advisors, Inc. (“Nottingham”) is an SEC registered investment adviser with its principal place of business in the State of New York. Nottingham and its representatives are in compliance with the current registration requirements imposed upon registered investment advisers by those states in which Nottingham maintains clients. Nottingham may only transact business in those states in which it is registered, or qualifies for an exemption or exclusion from registration requirements. This material is limited to the dissemination of general information pertaining to Nottingham’s investment advisory/management services. Any subsequent, direct communication by Nottingham with a prospective client shall be conducted by a representative that is either registered or qualifies for an exemption or exclusion from registration in the state where the prospective client resides.
The information contained herein should not be construed as personalized investment advice. Past performance is no guarantee of future results. Information contained herein should not be considered as a solicitation to buy or sell any security. Investing in the stock market involves the risk of loss, including loss of principal invested, and may not be suitable for all investors. This material contains certain forward-looking statements which indicate future possibilities. Actual results may differ materially from the expectations portrayed in such forward-looking statements. As such, there is no guarantee that any views and opinions expressed in this letter will come to pass. Additionally, this material contains information derived from third party sources. Although we believe these sources to be reliable, we make no representations as to the accuracy of any information prepared by any unaffiliated third party incorporated herein, and take no responsibility therefore. All expressions of opinion reflect the judgment of the authors as of the date of publication and are subject to change without prior notice. Past performance is not an indication of future results.
The indices referenced in the Nottingham Monthly Market Wrap are unmanaged and cannot be invested in directly. The returns of these indices do not reflect any investment management fees or transaction expenses. Had these additional fees and expenses been reflected, the returns of these indices would have been lower. Information herein has been obtained from third party sources that are believed to be reliable; however, the accuracy of the data is not guaranteed by Nottingham Advisors. The content of this report is as current as of the date indicated and is subject to change without notice.

For information pertaining to the registration status of Nottingham, please contact Nottingham or refer to the Investment Adviser Public Disclosure web site (www.adviserinfo.sec.gov). For additional information about Nottingham, including fees and services, send for our disclosure statement as set forth on Form ADV from Nottingham using the contact information herein. Please read the disclosure statement carefully before you invest or send money.
