
By Roman Chuyan, CFA
Elevated short-term risk on investor exuberance
- We have captured most of the market upside in November.
- While our 6-month Equity Model continues to indicate Positive Fundamentals, our Short-Term Risk model now gives a Sell signal because of exuberant investor sentiment.
The stock market rebounded strongly as investors turned optimistic after the election and positive vaccine news. November was the best month since April – the S&P 500 gained 11% in the month, taking its year-to-date gain to 14%. We had increased our equity exposure to a maximum on November 2nd on our models’ positive signals, which allowed us to capture most of the upside – instant gratification, which is very unusual in investing.
US and Foreign Stocks, Year-To-Date
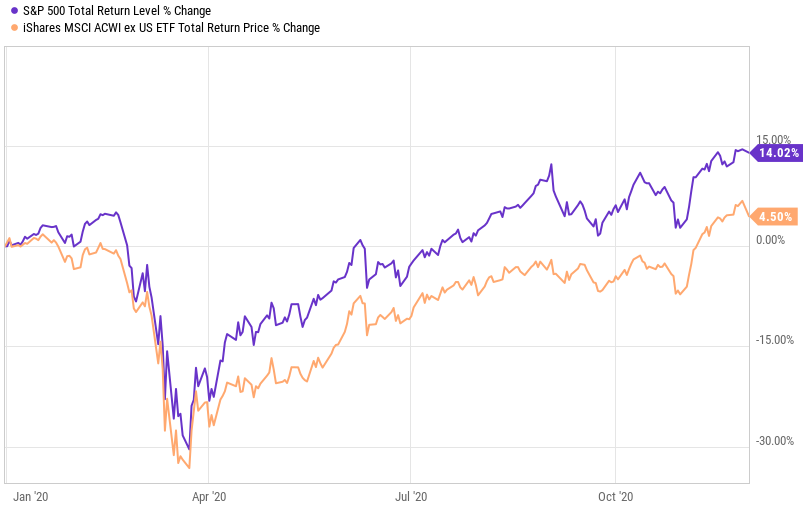
Source: Ycharts, as of 11/30/2020
Has the market rebounded too far, too fast? Sustainable rallies typically begin when the market is cheap, and continue on solid economic performance. Neither of these is in place now. The S&P 500 is overvalued by 14% according to our 6-month Equity Model, and economic factors provide only a low positive contribution. Instead, our model detects that the November rebound was based on investors redeploying cash after a short-term gain, or pure momentum.
Momentum rallies tend to end when investors fully deploy the cash earmarked as part of their risk assets, and there’s no buying power left. We can detect this with investor-sentiment measures. Our Short-Term Risk model includes a contrarian Investor Sentiment tool that detects the patterns of exuberant sentiment preceding market corrections.
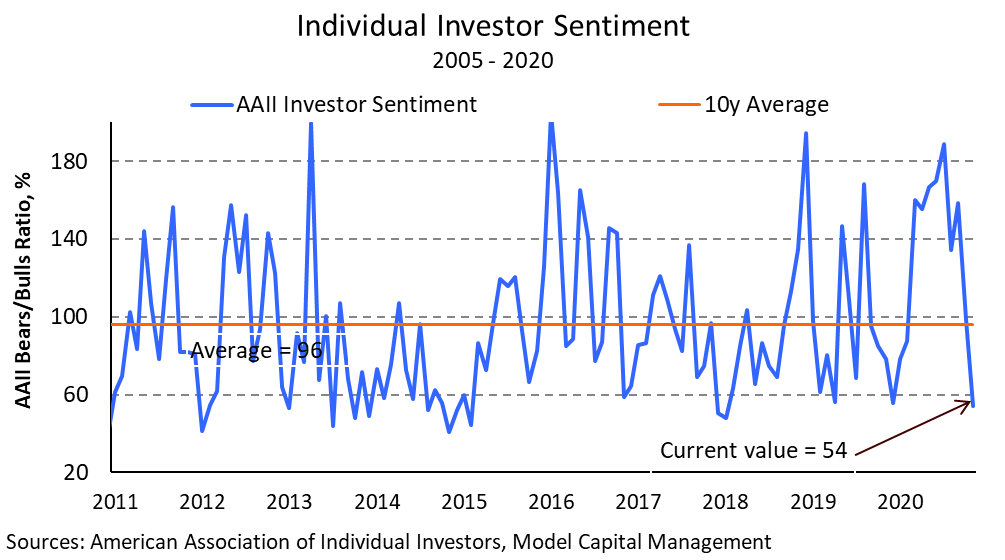
Our Risk model gave a Sell signal in the latter part of November based on its Investor Sentiment component. This pattern is characterized by quick reversal from bearish to exuberant sentiment when stocks rebound too far, too fast. Sentiment measures improved quickly and reached exuberant levels on a quick rise in the S&P 500 index in November. For example, the AAII Bears-to-Bulls ratio dropped to 54% on a moving-average basis (that is, bullish investors outnumber bearish by almost 2-to-1):
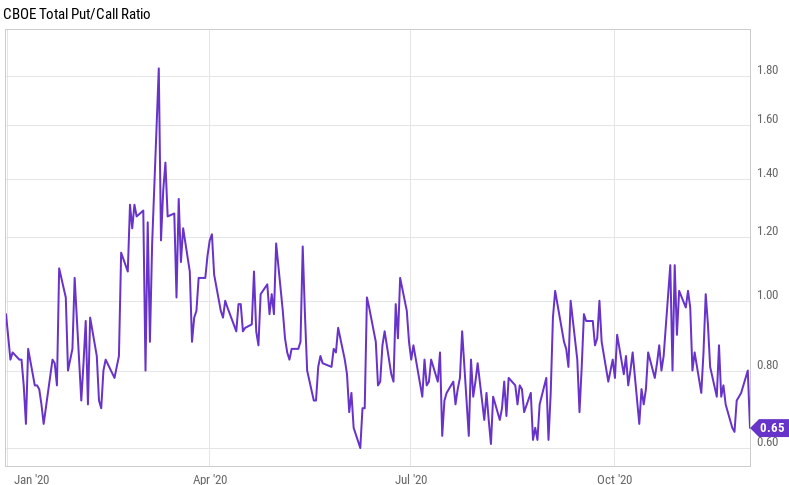
Another example is the Put-Call Ratio – the ratio of Put (bearish) to Call (bullish) options purchased by traders, mostly investment banks and hedge funds. A low Put-Call Ratio indicates bullish positioning, which is what we see now:
Let me finally note that only a couple of negative indicators wouldn’t necessarily mean danger ahead. However, our Sentiment tool includes a combination of seven indicators combining into certain patters that historically precede market corrections.
Now, a quick look at the economy. While economic rebound in Q3 was phenomenally strong, some indicators have weakened recently. Consumer Sentiment, which leads consumer spending, unexpectedly dropped in November to 76.9, and the Consumer Expectations sub-index weakened to 70.5. The earlier rebound in consumer sentiment now looks very similar to previous mid-recession bounces.

While stocks reached all-time highs, there are plenty of potential triggers for a correction. The vaccine is becoming available in record time as part of the administration’s Operation Warp Speed, so investors are choosing to ignore the pandemic for now. However, daily deaths rising above 2,000 last week and reaching a new record of 3,000 this week might lead to more widespread lockdowns similar to those now in place in Europe. In a Nov-29th interview, Dr. Fauci warned that he expects a “surge superimposed on the surge we are already in” after Thanksgiving travel. This appears to be unfolding. A large part of California is already under stay-at-home order. Also, the process of vaccinating the entire US population might take time and face unforeseen obstacles. As always, our investment process will be guided by our models.
About Model Capital Management LLC
Model Capital Management LLC (“MCM”) is an independent SEC-registered investment advisor, and is based in Wellesley, Massachusetts. Utilizing its fundamental, forward-looking approach to asset allocation, MCM provides asset management services that help other advisors implement its dynamic investment strategies designed to reduce significant downside risk. MCM is available to advisors on AssetMark, Envestnet, SMArtX, and other SMA/UMA platforms, but is not affiliated with those firms.
Notices and Disclosures
- This research document and all of the information contained in it (“MCM Research”) is the property of MCM. The Information set out in this communication is subject to copyright and may not be reproduced or disseminated, in whole or in part, without the express written permission of MCM. The trademarks and service marks contained in this document are the property of their respective owners. Third-party data providers make no warranties or representations relating to the accuracy, completeness, or timeliness of the data they provide and shall not have liability for any damages relating to such data.
- MCM does not provide individually tailored investment advice. MCM Research has been prepared without regard to the circumstances and objectives of those who receive it. MCM recommends that investors independently evaluate particular investments and strategies, and encourages investors to seek the advice of an investment adviser. The appropriateness of an investment or strategy will depend on an investor’s circumstances and objectives. The securities, instruments, or strategies discussed in MCM Research may not be suitable for all investors, and certain investors may not be eligible to purchase or participate in some or all of them. The value of and income from your investments may vary because of changes in securities/instruments prices, market indexes, or other factors. Past performance is not a guarantee of future performance, and not necessarily a guide to future performance. Estimates of future performance are based on assumptions that may not be realized.
- MCM Research is not an offer to buy or sell or the solicitation of an offer to buy or sell any security/instrument or to participate in any particular trading strategy. MCM does not analyze, follow, research or recommend individual companies or their securities. Employees of MCM may have investments in securities/instruments or derivatives of securities/instruments based on broad market indices included in MCM Research.
- MCM is not acting as a municipal advisor and the opinions or views contained in MCM Research are not intended to be, and do not constitute, advice within the meaning of Section 975 of the Dodd-Frank Wall Street Reform and Consumer Protection Act.
- MCM Research is based on public information. MCM makes every effort to use reliable, comprehensive information, but we make no representation that it is accurate or complete. We have no obligation to tell you when opinions or information in MCM Research change.
- MCM DOES NOT MAKE ANY EXPRESS OR IMPLIED WARRANTIES OR REPRESENTATIONS WITH RESPECT TO THIS MCM RESEARCH (OR THE RESULTS TO BE OBTAINED BY THE USE THEREOF), AND TO THE MAXIMUM EXTENT PERMITTED BY LAW, MCM HEREBY EXPRESSLY DISCLAIMS ALL WARRANTIES (INCLUDING, WITHOUT LIMITATION, ANY IMPLIED WARRANTIES OF ORIGINALITY, ACCURACY, TIMELINESS, NON-INFRINGEMENT, COMPLETENESS, MERCHANTABILITY AND/OR FITNESS FOR A PARTICULAR PURPOSE).
- “Model Return Forecast” for 6-month S&P 500 return is MCM’s measure of attractiveness of the U.S. equity market obtained by applying MCM’s proprietary statistical algorithm and historical data, but is not promissory, and, by itself, does not constitute an investment recommendation. Model Return Forecasts were calculated and applied by MCM to its research and investment process in real time beginning from 2012. For periods prior to Jan 2012, the results are “back-tested,” i.e., obtained by retroactively applying MCM’s algorithm and historical data available in Jan 2012 or thereafter. Source for the S&P 500 actual returns: S&P Dow Jones.
- Index returns referenced in MCM Research, if any, are gross of any advisory fees, fund management fees, and trading expenses. Fund or ETF returns referenced, if any, are gross of advisory fees and trading expenses. Returns will be reduced by fees and expenses incurred.
