
By Gary Stringer, Kim Escue and Chad Keller, Stringer Asset Management
It has been widely acknowledged that this year’s stock market returns have been led by a very narrow group of stocks. But just how narrow is it?
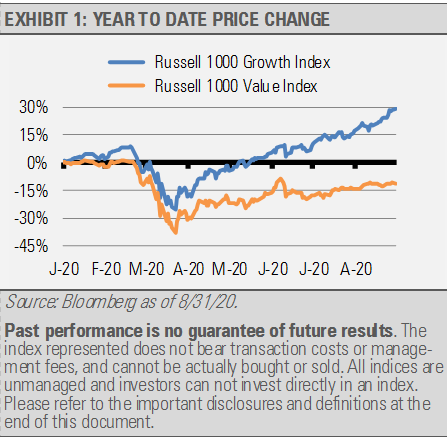
The S&P 500 Index has eclipsed the returns of the broader small cap Russell 2000 Index with a price return of 8.34% compared to down 6.39% for the small cap Index so far this year through August. Similarly, large cap growth stocks prices have outpaced cheaper value stocks by an even greater 40.53% (exhibit 1). The last time large cap U.S. growth equities outperformed their small cap and value brethren by such an extraordinary amount was the late 1990s and early 2000 tech bubble.
Looking at two of the S&P 500 Index’s largest sectors, information technology and financials, the information technology sector is up 34.82% while financials are down 18.74% for the year through August. This difference explains much of the outperformance of growth stocks mentioned above.

Clearly, sector selection has been impactful, but even more telling is the concentration of the returns among the largest companies. The S&P 500 Index is weighted by market capitalization which means the largest companies have the largest weighting in the Index and a greater impact on performance.
Of all companies within the Index, the top five by market capitalization make up nearly 20% of the Index weighting and have an average year-to-date price change of roughly 49.10%. The average price change for the remaining 80% of the S&P 500 Index is approximately –3.78%.
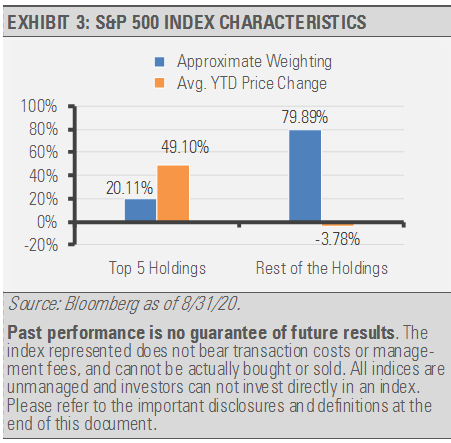
The year-to-date return for the remaining 80% of the S&P 500 Index is very similar to the –3.67% price change for the equally weighted S&P 500 Index.
Interestingly, this same phenomenon applies to the global equity market as represented by the MSCI All Country World Index (ACWI). This Index’s top five companies represent just over 10% of the global market capitalization and is greater than the total market capitalization of the listed domestic companies for Japan. Compared to the 49.10% average year-to-date price change for the ACWI’s top five holdings, the average year-to-date price change through August of the remaining nearly 90% of the more than 2,500 holdings in the ACWI is roughly –2.69%.
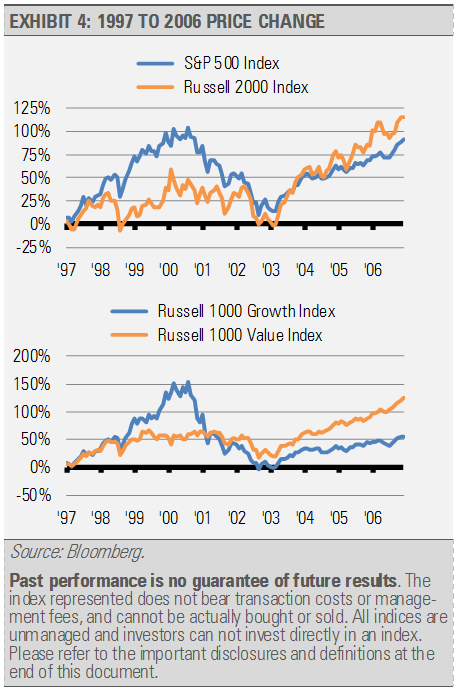
This begs the question of how representative a market capitalization weighted index is of the U.S. and global stock markets. As professional investors, we also wonder what this concentration of return might mean for these top performing stocks going forward. We expect a rotation will occur away from some of the top performing names and that the markets will begin to favor a broader set of opportunities as the global economic recovery persists. This would be analogous to the shift in market leadership after the Nifty Fifty run in the late 1960s and early 1970s as well as the Tech Bubble. Both environments were followed by strong relative performance from previous laggards which is a common occurrence. For example, small caps and value went on to lead in the early to mid-2000s (exhibit 4). As a result, we think that investors should be prepare for the next rotation.
This article was written by Gary Stringer, CIO, Kim Escue, Senior Portfolio Manager, and Chad Keller, COO and CCO at Stringer Asset Management, a participant in the ETF Strategist Channel.
DISCLOSURES
Any forecasts, figures, opinions or investment techniques and strategies explained are Stringer Asset Management, LLC’s as of the date of publication. They are considered to be accurate at the time of writing, but no warranty of accuracy is given and no liability in respect to error or omission is accepted. They are subject to change without reference or notification. The views contained herein are not to be taken as advice or a recommendation to buy or sell any investment and the material should not be relied upon as containing sufficient information to support an investment decision. It should be noted that the value of investments and the income from them may fluctuate in accordance with market conditions and taxation agreements and investors may not get back the full amount invested.
Past performance and yield may not be a reliable guide to future performance. Current performance may be higher or lower than the performance quoted.
The securities identified and described may not represent all of the securities purchased, sold or recommended for client accounts. The reader should not assume that an investment in the securities identified was or will be profitable.
Data is provided by various sources and prepared by Stringer Asset Management, LLC and has not been verified or audited by an independent accountant.
Index Definitions:
The S&P 500 Index is a capitalization-weighted index of 500 stocks. The Index is designed to measure performance of a broad domestic economy through changes in the aggregate market value of 500 stocks representing all major industries. The Russell 2000 Index is a measure of the small-capitalization sector of the U.S. equity market. The Index is capitalization-weighted and consists of the 2,000 smallest companies in the Russell 3000 Index. The S&P 500 Consumer Discretionary Index is capitalization-weighted and is designed to measure the consumer discretionary sector of the S&P 500 Index. The S&P 500 Consumer Staples Index is capitalization-weighted and is designed to measure the consumer staples sector of the S&P 500 Index. The S&P 500 Energy Index is capitalization-weighted and is designed to measure the energy sector of the S&P 500 Index. The S&P 500 Financials Index is capitalization-weighted and is designed to measure the financial sector of the S&P 500 Index. The S&P 500 Health Care Index is capitalization-weighted and is designed to measure the health care sector of the S&P 500 Index. The S&P 500 Industrials Index is capitalization-weighted and is designed to measure the industrial sector of the S&P 500 Index. The S&P 500 Information Technology Index is capitalization-weighted and is designed to measure the information technology sector of the S&P 500 Index. The S&P 500 Materials Index is capitalization-weighted and is designed to measure the materials sector of the S&P 500 Index. The S&P 500 Real Estate Index is capitalization-weighted and is designed to measure the real estate sector of the S&P 500 Index. The S&P 500 Telecommunication Services Index is capitalization-weighted and is designed to measure the telecommunication services sector of the S&P 500 Index. The S&P 500 Utilities Index is capitalization-weighted and is designed to measure the utilities sector of the S&P 500 Index. The MSCI ACWI Index is a free float-adjusted market capitalization weighted index that is designed to measure the equity market performance of developed and emerging markets. The MSCI ACWI Index consists of 23 developed and 23 emerging market country indexes. The Russell 1000 Growth Index measures the performance of the large cap growth segment of the US equity universe. It includes those Russell1000 companies with higher price-to-book ratios and higher forecasted growth values. The Russell 1000 Growth Index is constructed to provide a comprehensive and unbiased barometer for the large-cap growth segment. The index is completely reconstituted annually to ensure new equities are included and that the represented companies continue to reflect growth characteristics. The Russell 1000 Value Index measures the performance of the large cap value segment of the US equity universe. It includes those Russell1000 companies with lower price-to-book ratios and lower forecasted growth values. The Russell 1000 Value Index is constructed to provide a comprehensive and unbiased barometer for the large-cap value segment. The index is completely reconstituted annually to ensure new equities are included and that the represented companies continue to reflect value characteristics.
