
- Four U.S. bank failures beginning with SVB rattled the banking world in March.
- Banks have serious problems of declining revenue and negative interest margin.
A slew of failures rattled the banking world in early March. It included four US banks and a major European investment bank. Below is a summary of what happened, and my take on why. Understanding the reasons will allow us to make an educated guess on whether the pressure on banks will continue.
First, let us note how partial reserve banking works. Banks today are required to keep 8.5% of assets in liquid reserves, while the rest is given out as loans. That’s why large withdrawals present a problem. Even the 8.5% reserve itself, typically invested in Treasuries, might lose value – see more on this below. Withdrawals that approach the amount of reserves – a “run on a bank” – lead to its insolvency.
What Happened
The debacle began quietly on March 8th when California’s Silvergate Capital announced voluntarily liquidation. The “cryptocurrency bank” faced billions in withdrawals after a collapse in the crypto market in recent months.
Two days later, California’s Silicon Valley Bank (SVB) collapsed. It experienced sharp deposit outflows in early March that totaled $42 billion. The bank’s desperate attempt to raise capital by selling stock failed, and it was shut down and taken over by the FDIC on Friday, March 10th. SVB was quite large – the country’s 16th largest bank with $209 billion in assets. It became the second largest bank failure in U.S. history, after Washington Mutual during the height of the 2008 financial crisis. Its business was focused on venture capital and technology clients.
On the heels of SVB’s failure, concerns about the banking industry spread as investors turned their focus to several other regional banks. The regional bank index plunged by 30% (see chart below), and many bank shares by 70-80% in just a week. First Republic, a San Francisco lender that served the venture capital and tech space, saw deposit outflows that were later estimated to total $70 billion. It was forced by regulators to be acquired by First Citizens Bank later in March.
On March 12th, regulators unexpectedly shut down Signature Bank in New York which had also focused on venture capital and tech clients – it became the third largest bank failure in U.S. history, with $118 billion in assets.
All failed banks seem to be connected to the venture capital space. As IPOs dried up las year due to the stock market decline and the crypto debacle, some VC firms found themselves short of cash.
SPDR S&P Regional Banking ETF (KRE), 1 Year
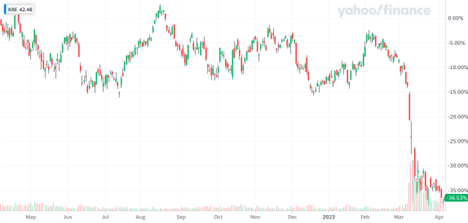
Source: Yahoo Finance
The crisis also reached Europe with Swiss second-largest bank Credit Suisse in the center, which faced declining revenue and net loss for years. The Swiss government forced it to be acquired by its larger rival UBS on that day for meager $3.24 billion – 30% of its market cap just two weeks ago.
Fundamental Problems
The regulators learned their lesson from 2007-08. This time, they stepped in quickly to halt the spreading bank runs. But bank problems are fundamental and broad, going beyond the venture capital space or safety of deposits in a handful of banks. As I see it, these problems fall into three categories:
- Dropping lending volume (bank revenue);
- Dropping/negative net interest margin (bank income);
- Declining asset values.
Let me briefly cover each item today, and I might add more detail in future articles.
Existing Home Sales, 25 Years
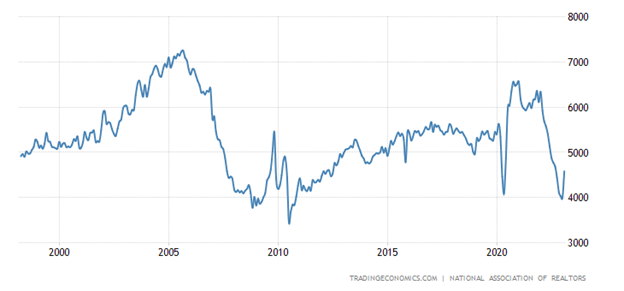
Lending is banks’ primary business, directly impacting the top line – and it dropped substantially over the course of 2022. This is evident in mortgage applications, home sales (that drive mortgage issuance) and the overall credit growth reported by the Fed. For example, existing home sales plunged from over 6 million in 2021 to 4m–4.6m annual rate (see chart above). If they stabilize around, say, 4.5m this year, it will make a drop of 25%. In 27 years, excluding a brief period in 2020 in the midst of COVID pandemic, sales have only been lower in 2008 and 2010.
The second problem impacts bank profit margins. Banks borrow (mostly) short-term and make longer-term loans. Normally, the spread between long and short-term rates is positive (a “normal” yield curve), giving banks a positive net interest margin. Banks need the margin to be substantial, larger than 1%, to cover their expenses. Today, however, the yield curve is inverted by more than 1% (see chart below), giving banks a substantially-negative margin. So, banks are facing interest losses on most of their lending.
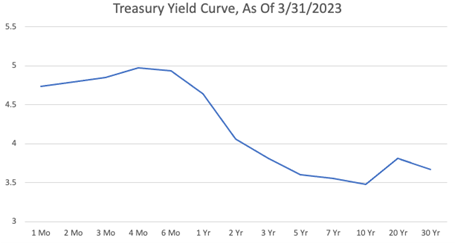
Source: US Treasury
This has happened before – an inverted yield curve decimated the bank and savings & loans industry in the 1980s.
A mitigating factor is that deposits are still low-cost as customers got used to low interest after years of near-zero rates. But this is changing – customers seek higher rates, and bankers are forced to raise them to attract new depositors or even to keep them from fleeing.
The third problem is declining asset values. Banks invest their reserves in Treasury notes and MBS, and their values have dropped due to rising market yields. For example, 7-10 year Treasuries were trading at a 16% loss from two years ago at the beginning of March (see chart below), when the failing banks had to sell them to pay out fleeing depositors.
However, longer-term yields decreased somewhat and bond values rose in March. While not nearly eliminating this problem for banks, I expect it to improve going forward.
iShares 7-10 Year Treasury Bond ETF (IEF), 2 Years
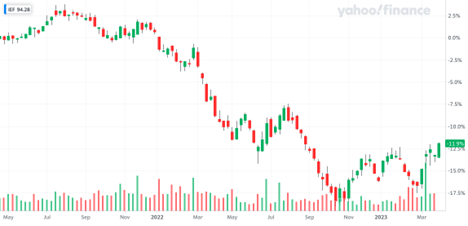
Source: Yahoo Finance
To summarize, while the banks that failed in March all seem to be connected to the venture capital space, the banking industry itself has serious fundamental problems of declining revenue and negative interest margin. These problems have worsened over the course of 2022: lending declined, and the yield curve became the most inverted since 1981.
Let us keep in mind that 2022 was a year of economic growth. The economy is now slowing. An inverted yield curve is considered a reliable recession warning: it has preceded all eight of recent recessions. If it’s right once again, we might have a recession in 2023, with many additional problems for banks including deteriorating creditworthiness of borrowers and collateral values.
About Model Capital Management LLC
Model Capital Management LLC (“MCM”) is an independent SEC-registered investment adviser, and is based in Waltham, Massachusetts. Utilizing its fundamental, forward-looking approach to asset allocation, MCM provides asset management services aimed to help other advisors implement its dynamic investment strategies designed to reduce significant downside risk. MCM is available to advisors on SMArtX Advisory, Axos Advisor Services, and Envestnet platforms, but is not affiliated with those firms.
Notices and Disclosures
- This research document and all of the information contained in it (“MCM Research”) is the property of MCM. The Information set out in this communication is subject to copyright and may not be reproduced or disseminated, in whole or in part, without the express written permission of MCM. The trademarks and service marks contained in this document are the property of their respective owners. Third-party data providers make no warranties or representations relating to the accuracy, completeness, or timeliness of the data they provide and shall not have liability for any damages relating to such data.
- MCM does not provide individually tailored investment advice. MCM Research has been prepared without regard to the circumstances and objectives of those who receive it. MCM recommends that investors independently evaluate particular investments and strategies and encourages investors to seek the advice of an investment adviser. The appropriateness of an investment or strategy will depend on an investor’s circumstances and objectives. The securities, instruments, or strategies discussed in MCM Research may not be suitable for all investors, and certain investors may not be eligible to purchase or participate in some or all of them. The value of and income from your investments may vary because of changes in securities/instruments prices, market indexes, or other factors. Past performance is not a guarantee of future performance, and not necessarily a guide to future performance. Estimates of future performance are based on assumptions that may not be realized.
- MCM Research is not an offer to buy or sell or the solicitation of an offer to buy or sell any security/instrument or to participate in any particular trading strategy. MCM does not analyze, follow, research or recommend individual companies or their securities. Employees of MCM may have investments in securities/instruments or derivatives of securities/instruments based on broad market indices included in MCM Research. MCM’s Form ADV, Part 2A (Brochure) contains further details pertaining to employee training.
- MCM is not acting as a municipal advisor and the opinions or views contained in MCM Research are not intended to be, and do not constitute, advice within the meaning of Section 975 of the Dodd-Frank Wall Street Reform and Consumer Protection Act.
- MCM Research is based on public information. MCM makes every effort to use reliable, comprehensive information, but we make no representation that it is accurate or complete. Opinions or information are subject to change with respect to MCM Research.
- MCM DOES NOT MAKE ANY EXPRESS OR IMPLIED WARRANTIES OR REPRESENTATIONS WITH RESPECT TO THIS MCM RESEARCH (OR THE RESULTS TO BE OBTAINED BY THE USE THEREOF), AND TO THE MAXIMUM EXTENT PERMITTED BY LAW, MCM HEREBY EXPRESSLY DISCLAIMS ALL WARRANTIES (INCLUDING, WITHOUT LIMITATION, ANY IMPLIED WARRANTIES OF ORIGINALITY, ACCURACY, TIMELINESS, NON-INFRINGEMENT, COMPLETENESS, MERCHANTABILITY AND/OR FITNESS FOR A PARTICULAR PURPOSE).
- “Model Return Forecast” for 6-month S&P 500 return is MCM’s measure of attractiveness of the U.S. equity market obtained by applying MCM’s proprietary statistical algorithm and historical data, but is not promissory, and, by itself, does not constitute an investment recommendation. Model Return Forecasts were calculated and applied by MCM to its research and investment process in real time beginning from 2012. For periods prior to Jan 2012, the results are “back-tested,” i.e., obtained by retroactively applying MCM’s algorithm and historical data available in Jan 2012 or thereafter. Back-tested performance, if any, is presented gross of any advisory fees and trading expenses. Index returns referenced in MCM Research, if any, are gross of any advisory fees, fund management fees, and trading expenses. Fund or ETF returns referenced, if any, are gross of advisory fees and trading expenses. Returns will be reduced by fees and expenses incurred.
