
In this short update, let’s go over a few brief points of emphasis for the markets right now.
- In late January, the S&P 500 broke out above the trend line drawn from its successive lower peaks (see chart below, point 1). At previous peaks, this trend line had been resistance. This past “resistance” trend line should now be support.
- Since its low in October, the market index has established a higher high and higher low. We wrote two weeks ago that a pullback would be normal. After the S&P 500’s bounce late last week, it is attempting to form another “higher low” (see chart below, point 2).
- These two trend lines, both the descending line drawn across the market’s prior peaks (point 1) and the ascending line drawn from the prior two relative lows (point 2), intersect at where the market’s 200-day moving average of price is right now (chart below, point 3). The 200-day moving average can also act as resistance or support.
- On Thursday of last week, the S&P 500 finished above these two trendlines and its 200-day moving average. Last Friday, it bounced off these three areas of support. That is positive in the short-term, and we will see if the market can continue hold support in this area.
- Long-term volatility (as measured by the Canterbury Volatility Index, CVI) continues to decline even with the market’s recent pullback. Right now, our Volatility index measures CVI 90, the lowest level since February 2022. In the chart below at point 5, you can see that short-term volatility (in red) is below long longer-term volatility (in green) and both are declining. Declining volatility is a positive sign for the market. The market has pulled back from its recent high, but short-term volatility is still declining and does not indicate that the market’s volatility is trying to increase.
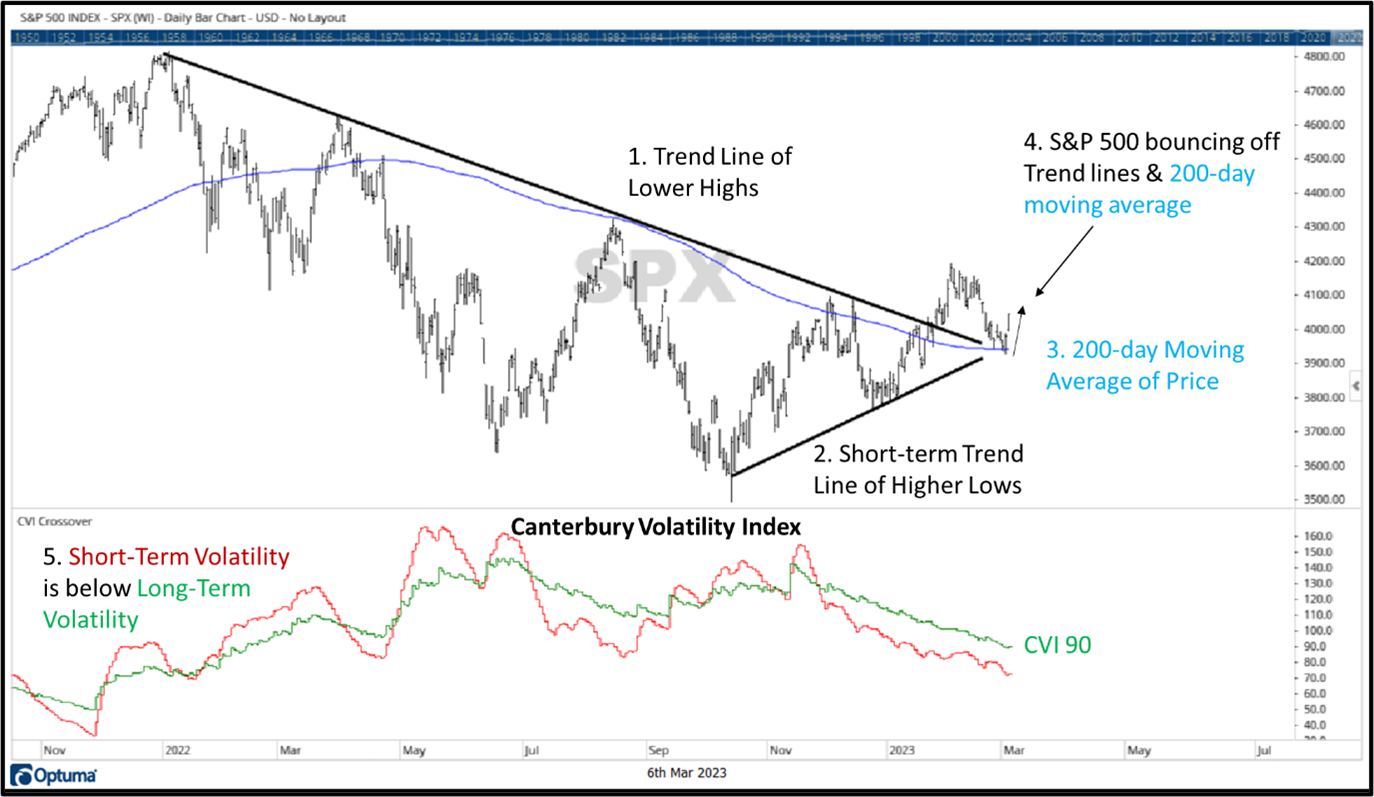
Source: Canterbury Investment Management. Chart created using Optuma Technical Analysis Software.
Sector Rotation
Looking at the global markets, international equities continue to rank higher than most US sectors on a risk-adjusted basis. That being said, the US markets are not favoring more traditionally “defensive” industries. Canterbury’s risk adjusted rankings show that Industrials, Basic Materials, Financials, and Information Technology are the top 4 S&P 500 sectors, while those traditionally “defensive” sectors like Utilities, Staples, and Health Care are at the bottom of the sector rankings.
Nasdaq
The Nasdaq index is primarily composed of technology-related securities. These same stocks play a large role in the movement of the S&P 500, due to their large market capitalization. Because of their large market share within the index, technology stocks and the Nasdaq have tended to lead during market rallies and lag during declines. With the markets recent, slight pullback from its latest high, one positive is that the Nasdaq index has not lagged. In fact, its relative strength to the S&P 500 since the market’s peak in early February has been flat.
In the chart below, you can see that the Nasdaq is attempting to test its 200-day moving average for support. Last Friday, the Nasdaq rose above its 200-day moving average (point 1). The lower portion of the chart shows the Nasdaq’s relative strength to the S&P 500. While the Nasdaq has previously underperformed during market declines (point 2) and outperformed during rallies (point 3), the Nasdaq’s relative strength vs the S&P 500 has been flat during the recent pullback (point 4).

Source: Canterbury Investment Management. Chart created using Optuma Technical Analysis Software.
Bottom Line
Right now, many major indexes, like the S&P 500 are at a point of support. The market index is currently sitting at the intersection of some trend lines and its 200-day moving average. Last Friday, a few of these indexes made a move higher in attempt to confirm support. Although this was a short-term move, it is a step in the right direction to forming another higher low. We will see if that trend can continue.
Regardless, Canterbury continues to monitor and make changes to portfolio allocations as market conditions rotate and change. Canterbury’s Portfolio Thermostat maintains a diversified portfolio of securities that create an “effectively” diversified portfolio to limit fluctuations. The goal is to maintain consistent portfolio volatility regardless of the overall market environment- bull or bear.
For more news, information, and analysis, visit the ETF Strategist Channel.
