
By Roman Chuyan, CFA
A View on Stocks and Commodities
- In this year-end note, I offer a longer-term perspective on US stocks over the past two decades, and what to expect in the 2020’s.
- Our 7-year model forecasts low return for stocks, and we think commodities will outperform.
The pandemic left a dark mark on last year, with illness, loss of life, a recession, and massive unemployment. But it was another good year for investors. The S&P 500 fully recovered from a 35% peak-to-trough plunge in March when the pandemic hit and finished the year up 18.4% (including dividends).
As we are closing not only the year but also the 2011-2020 decade, I offer a longer-term perspective in this note. What drove stock returns in the past decade, and is it likely to continue in the 2020’s?
Let’s compare the past two decades:
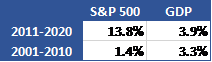
Compounded annual total return on S&P 500,
Compounded annual nominal GDP growth.
The stock market gained a remarkable 13.8% annually in the 2010’s (264% cumulative), almost ten times its annualized gain in the 2000’s. At the same time, nominal GDP growth was similar in the 2010’s (3.9%) to the 2000’s (3.3%). The two recessions of the 2000’s hurt stocks more than they hurt the economy, but stock return was nonetheless close to economic growth. In the 2010’s, stocks became disconnected from the economy.
Stocks, GDP, and the Fed, 10 Years
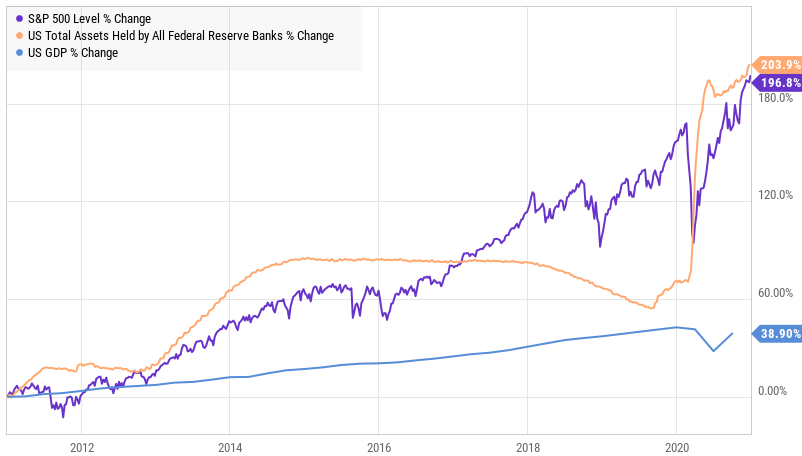
Source: Ycharts, as of 12/31/2020
You’ve probably guessed where I’m going with this. The Fed drove the returns in the 2010’s much more than the economy did – specifically, the Fed’s money-creating policies. As shown in the chart above, the Fed tripled the assets on its balance sheet (the yellow line) in the 2010’s, to now $7.4 trillion. The S&P 500 followed the Fed’s balance sheet rather than GDP (the light-blue line) – it also tripled in the same period (excluding dividends).
To get a sense of what to expect from the market going forward, we at Model Capital use forecasting models. To look far ahead, we use our 7-year model for the S&P 500. Keep in mind that a 7-year horizon is too long for tactical investing – the market can change many times in seven years. But it gives a useful long-term perspective, and I sometimes write about it at year-end.

According to our research, the best single factor that determines 7-year market returns is the total allocation to stocks by all investors (blue bars on the chart above, scaled with the left Y axis). This is the total percentage of portfolios that all individual and institutional investors, in aggregate, have invested in stocks and stock funds. When this allocation is low (there’s room to buy more), subsequent 7-year return (the green line, right Y axis) tends to be higher, often above 10% annually. On the other hand, when stock allocation is already high (no room to buy), subsequent 7-year return tends to be lower, often near zero. Stock allocation dropped below 30% after the bear market ended in 2009, and subsequent 7-year returns were above 10% annually from 2009 to 2013. (The green line doesn’t go any further because 2013 is the latest year for which the subsequent 7-year return is available, 2014-2020.)
Our model’s 7-year return forecasts based on this and other factors are shown by the dark-red line. The forecast tells us what 7-year return we should expect going forward, given the total stock allocations (and other factors) at the time. The forecasts (the red line) track actual returns closely, which suggests that the model has been reasonably accurate.
The current stock allocation (the right-most blue bar), at 46.4%, is near its highest since data began in 1950. It matches the allocation on 12/31/2019 (which preceded the Feb-Mar 2020 plunge) and was exceeded only during the dot-com bubble in the late-1990’s (which was eventually followed by the 2001-02 bear market). This suggests that investors are fully invested in stocks right now and there’s no room to buy more. The model’s current 7-year forecast is only 1.6% annually.
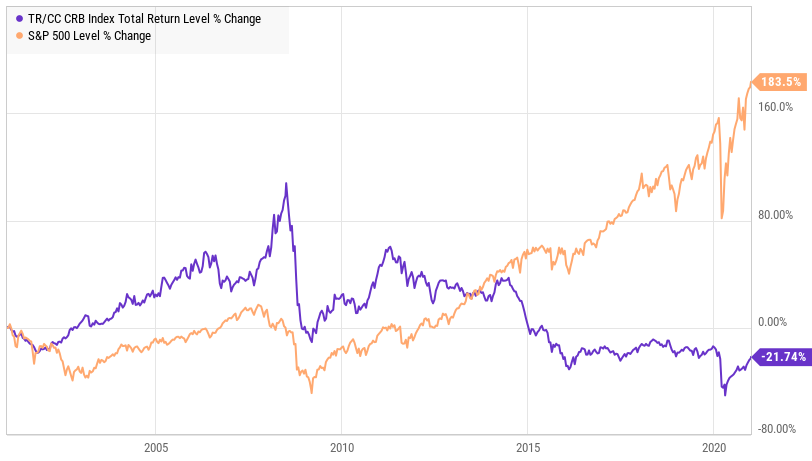
Return expectation is very important for strategic asset allocators. Strategists expect stocks to continue to deliver a 10% or higher annual return. If such a low return is realized instead, most pension funds will not achieve their targets. For tactical managers like us who attempt to manage “the ride,” a 7-year annual return forecast of 1.6% suggests an environment similar to the 2000’s when average annual return was 1.4%, as I detailed at the beginning. That decade included two severe bear markets, in 2001-02 and 2007-09 (the left half of the 20-year chart below), which made the overall return in that period so low. This is a type of market environment we expect in the coming years – rallies giving way to declines, and a low overall return.
Stocks and Commodities, 20 Years
What if the Fed keeps creating money? The Fed brought interest rates to zero and roughly doubled its assets to $7.4 trillion in 2020, by buying bonds, creating trillions of dollars of new money (the Fed buying anything by definition amounts to creating new money). Money-creation certainly looks to continue, with a return to prudent monetary policy looking more and more unlikely. With pandemic crisis last year, any opposition to these policies from fiscally-conservative Republicans was rendered unpopular. A return to prudent policies just became even more unlikely this month, with Democrats gaining control of the Senate in addition to the presidency and the House of Representatives.
But it might not lift stock return significantly above 1.6%, and significant downturns are still likely to happen, as they did in 2018 and in 2020. Money-creation made most assets very expensive over the past 10 years – stocks, bonds, and real estate – but not commodities. The Commodity Research Bureau’s (CRB) index outperformed stocks in the 2000’s but dropped by 46% in the 2010’s (see chart above). This left commodities the only asset type that’s not extremely overvalued, and it might reverse in the coming years as relative valuation evens out, especially if money-creation continues.
About Model Capital Management LLC
Model Capital Management LLC (“MCM”) is an independent SEC-registered investment advisor, and is based in Wellesley, Massachusetts. Utilizing its fundamental, forward-looking approach to asset allocation, MCM provides asset management services that help other advisors implement its dynamic investment strategies designed to reduce significant downside risk. MCM is available to advisors on AssetMark, Envestnet, SMArtX, and other SMA/UMA platforms, but is not affiliated with those firms.
Notices and Disclosures
- This research document and all of the information contained in it (“MCM Research”) is the property of MCM. The Information set out in this communication is subject to copyright and may not be reproduced or disseminated, in whole or in part, without the express written permission of MCM. The trademarks and service marks contained in this document are the property of their respective owners. Third-party data providers make no warranties or representations relating to the accuracy, completeness, or timeliness of the data they provide and shall not have liability for any damages relating to such data.
- MCM does not provide individually tailored investment advice. MCM Research has been prepared without regard to the circumstances and objectives of those who receive it. MCM recommends that investors independently evaluate particular investments and strategies, and encourages investors to seek the advice of an investment adviser. The appropriateness of an investment or strategy will depend on an investor’s circumstances and objectives. The securities, instruments, or strategies discussed in MCM Research may not be suitable for all investors, and certain investors may not be eligible to purchase or participate in some or all of them. The value of and income from your investments may vary because of changes in securities/instruments prices, market indexes, or other factors. Past performance is not a guarantee of future performance, and not necessarily a guide to future performance. Estimates of future performance are based on assumptions that may not be realized.
- MCM Research is not an offer to buy or sell or the solicitation of an offer to buy or sell any security/instrument or to participate in any particular trading strategy. MCM does not analyze, follow, research or recommend individual companies or their securities. Employees of MCM may have investments in securities/instruments or derivatives of securities/instruments based on broad market indices included in MCM Research.
- MCM is not acting as a municipal advisor and the opinions or views contained in MCM Research are not intended to be, and do not constitute, advice within the meaning of Section 975 of the Dodd-Frank Wall Street Reform and Consumer Protection Act.
- MCM Research is based on public information. MCM makes every effort to use reliable, comprehensive information, but we make no representation that it is accurate or complete. We have no obligation to tell you when opinions or information in MCM Research change.
- MCM DOES NOT MAKE ANY EXPRESS OR IMPLIED WARRANTIES OR REPRESENTATIONS WITH RESPECT TO THIS MCM RESEARCH (OR THE RESULTS TO BE OBTAINED BY THE USE THEREOF), AND TO THE MAXIMUM EXTENT PERMITTED BY LAW, MCM HEREBY EXPRESSLY DISCLAIMS ALL WARRANTIES (INCLUDING, WITHOUT LIMITATION, ANY IMPLIED WARRANTIES OF ORIGINALITY, ACCURACY, TIMELINESS, NON-INFRINGEMENT, COMPLETENESS, MERCHANTABILITY AND/OR FITNESS FOR A PARTICULAR PURPOSE).
- “Model Return Forecast” for 6-month S&P 500 return is MCM’s measure of attractiveness of the U.S. equity market obtained by applying MCM’s proprietary statistical algorithm and historical data, but is not promissory, and, by itself, does not constitute an investment recommendation. Model Return Forecasts were calculated and applied by MCM to its research and investment process in real time beginning from 2012. For periods prior to Jan 2012, the results are “back-tested,” i.e., obtained by retroactively applying MCM’s algorithm and historical data available in Jan 2012 or thereafter. Source for the S&P 500 actual returns: S&P Dow Jones.
- Index returns referenced in MCM Research, if any, are gross of any advisory fees, fund management fees, and trading expenses. Fund or ETF returns referenced, if any, are gross of advisory fees and trading expenses. Returns will be reduced by fees and expenses incurred.
