
By Stringer Asset Management
Our strategic and tactical work suggests that both the market and economic recoveries will persist, albeit at a slower pace. It may take more than a year for the U.S. economy to regain its previous level of activity and employment, but the recovery is well on its way. The economic backdrop is promising, and we think the massive and speedy recovery in the third quarter following a brief, yet steep, economic decline will mark the shortest recession in U.S. history dating back to 1852. The U.S. economy likely expanded by roughly 30% on an annualized basis this past quarter based on the indicators we monitor. Future growth will slow but should continue for the next few years.
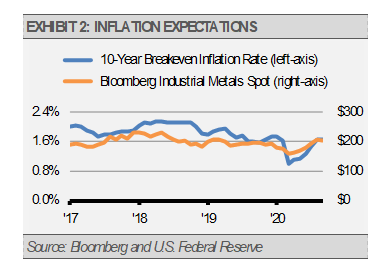
The U.S. Federal Reserve’s (the Fed) huge monetary support initially served to stabilize the financial markets and will continue to support a favorable environment for growth. In fact, the Fed’s balance sheet has grown nearly 83% from this point last year, which is twice the pace of the European Central Bank and four times as much as the Bank of Japan. As a result, our most sensitive leading indicators, such as liquidity growth, inflation expectations, and the prices of industrial metals, started to turn upwards in April and May. These trends continue today. In fact, on a year-over-year basis, liquidity growth in the U.S., as measured by narrow money or M1, has grown by almost 45%, which is the fastest pace of any major economy in the world.

As a result, market-based inflation expectations have improved in the U.S. better than in any other country. This suggests that the Fed’s policy actions have not only helped to stabilize the markets, but also are helping to improve economic activity.
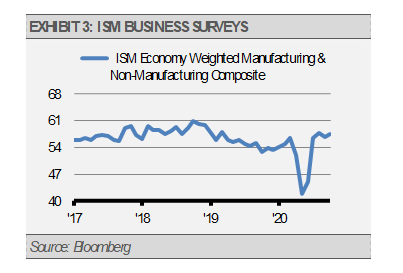
As support spreads through the economy more broadly, we are seeing consistent gains in more fundamental leading indicators, such as various purchasing manager indices (PMIs). PMI improvements, along with other fundamental indicators, are a positive reflection of overall business confidence, which tends to lead to increases in capital investment. As the following graph illustrates, these business surveys have made a sharp and impressive recovery.
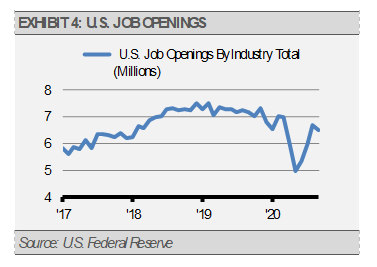
With businesses improving, we will likely see more productivity growth and additional jobs creation. In fact, the number of open jobs has risen to over 6 million. This represents both another sharp recovery and suggests there is a strong case for future jobs gains.
Still, much of the lost economic ground has already been regained, and our indicators suggest that the pace of improvement will slow. This is reflected in our GDP forecast of roughly 30% annualized growth in the third quarter, followed by 6% annualized growth in the fourth quarter, and an average growth of 4.5% in 2021. We think that this will have important implications for corporate revenue and earnings growth going forward.

INVESTMENT IMPLICATIONS
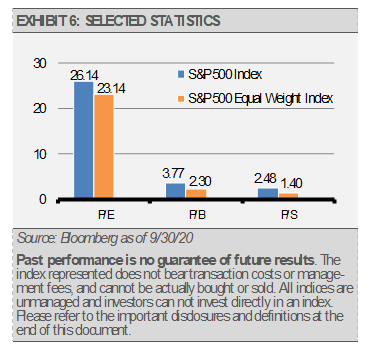
While the pace of business improvements will likely slow in the coming months, stock market advancements should broaden to include areas beyond online shopping. Reflecting the realities of the COVID economy, internet and technology related businesses boomed and their stock prices soared. This was exhibited in the largest companies in the S&P 500 Index, which all benefited from this environment. As the stocks of the top five companies in the S&P 500 Index, which now make up more than 20% of the Index, moved higher, they propelled the Index value as well. Looking at a broader comparison, consider the difference in appreciation between the S&P 500 Price Index (capitalization weighted) and its equally weighted version. Since the beginning of the year through September, the Price Index has risen more than 4% while the equally weighted Index is down more than 6%. Clearly their dispersion is striking, however, we see an opportunity. The S&P 500 Index is significantly more expensive than the equally weighted version. In fact, the equally weighted version trades at an 11% discount on price-to-earnings, 39% on price-to-book value, and 44% on price-to-sales.
Combined, these points have led us to favor areas of the equity markets that we think can benefit both strategically and tactically from the sustained economic recovery and where stock prices still have room to run in our opinion. These opportunistic areas include health care, consumer staples, industrials, and financials among others.
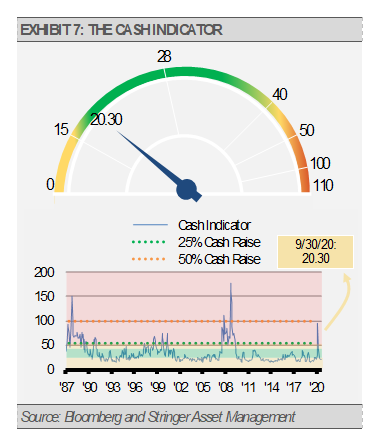
THE CASH INDICATOR
In a year where the Cash Indicator served as an invaluable portfolio management tool, we have seen the level of our Cash Indicator (CI) continue to decline recently. Keep in mind that the CI informs us about extreme market dislocations on the high end and complacency on the low end. Currently, the CI remains above the threshold that makes us concerned about market complacency, but we think that investors should still be prepared for volatility. Given the solid fundamental backdrop and the level of the CI, we think that market volatility presents a buying opportunity for disciplined investors.
Originally published by Stringer Asset Management
DISCLOSURES
Any forecasts, figures, opinions or investment techniques and strategies explained are Stringer Asset Management, LLC’s as of the date of publication. They are considered to be accurate at the time of writing, but no warranty of accuracy is given and no liability in respect to error or omission is accepted. They are subject to change without reference or notification. The views contained herein are not to be taken as advice or a recommendation to buy or sell any investment and the material should not be relied upon as containing sufficient information to support an investment decision. It should be noted that the value of investments and the income from them may fluctuate in accordance with market conditions and taxation agreements and investors may not get back the full amount invested.
Past performance and yield may not be a reliable guide to future performance. Current performance may be higher or lower than the performance quoted.
The securities identified and described may not represent all of the securities purchased, sold or recommended for client accounts. The reader should not assume that an investment in the securities identified was or will be profitable.
Data is provided by various sources and prepared by Stringer Asset Management, LLC and has not been verified or audited by an independent accountant
Index Definitions:
S&P 500 Index – This Index is a capitalization-weighted index of 500 stocks. The Index is designed to measure performance of a broad domestic economy through changes in the aggregate market value of 500 stocks representing all major industries.
S&P 500 Equal Weight Index – This Index is an equal-weight version of the widely used S&P 500 Index. The index includes the same constituents as the capitalization weighted S&P 500 Index, but each company in the S&P 500 Equal Weight Index is allocated a fixed weight of roughly 0.2% of the Index total at each quarterly rebalance.
