
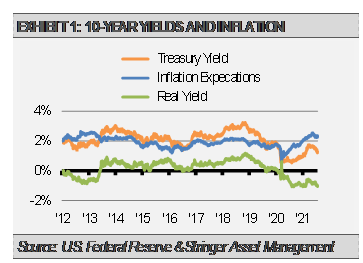
The real yield, which is the yield an investor receives after adjusting for inflation, on the 10-Year U.S. Treasury bond recently reached a record low level. To calculate the real yield, we simply take the current 10-year Treasury yield and subtract the current 10-year inflation expectations as measured by the Treasury Inflation Protected Security (TIPS) breakeven spread. This breakeven inflation rate represents a measure of expected inflation, and the latest value implies what market participants expect inflation to be in the next 10 years on average.
This means that after accounting for inflation expectations, the inflation-adjusted yield on the 10-Year Treasury bond is now quite negative. The real yield has been negative from time to time in the past, but it is now lower than ever. This is true even though the nominal yield is 0.7% higher than its low last August.
As we have shown before, 10-Year Treasury yields are related to the pace of economic growth in nominal terms (NGDP), which includes inflation, over time. For instance, low long-term interest rates usually suggest that the bond market expects low NGDP growth going forward.
However, other factors can play an outsized role over shorter periods. Current inflation expectations are at 2.4%, which is well above the U.S. Federal Reserve’s 2% target. This suggests that though 10-year Treasury yields are muted, the bond market is pricing in something other than just low inflation.
Additionally, since tight corporate bond spreads and healthy commodity price trends reflect confidence and expectations of solid economic growth ahead, something other than slow real economic growth is likely pushing 10-Year Treasury yields to very low levels.
Unique to the current environment is the massive amount of liquidity stimulus the U.S. Federal Reserve and other global central banks have pushed into the financial system. As the following graph illustrates, the Fed injected trillions of dollars into the U.S. financial system. We estimate that the current amount of liquidity in the U.S., as measured by M2 (cash, checking accounts, and savings deposits, etc.), is $3.9 trillion or 25% more than what it would have been based on the pre-COVID trend.
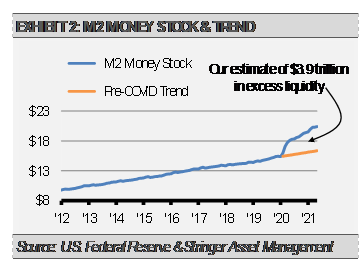
We think that there is so much cash in the financial system looking for a safe area and buying U.S. Treasury bonds that it is pushing bond prices higher and yields lower than they would otherwise be. Importantly, as the Fed begins to reduce its ongoing support in the coming months, we expect this trend to reverse and 10-Year Treasury yields to again move higher, and likely much higher.
DISCLOSURES
Any forecasts, figures, opinions or investment techniques and strategies explained are Stringer Asset Management, LLC’s as of the date of publication. They are considered to be accurate at the time of writing, but no warranty of accuracy is given and no liability in respect to error or omission is accepted. They are subject to change without reference or notification. The views contained herein are not to be taken as advice or a recommendation to buy or sell any investment and the material should not be relied upon as containing sufficient information to support an investment decision. It should be noted that the value of investments and the income from them may fluctuate in accordance with market conditions and taxation agreements and investors may not get back the full amount invested.
Past performance and yield may not be a reliable guide to future performance. Current performance may be higher or lower than the performance quoted.
The securities identified and described may not represent all of the securities purchased, sold or recommended for client accounts. The reader should not assume that an investment in the securities identified was or will be profitable.
Data is provided by various sources and prepared by Stringer Asset Management, LLC and has not been verified or audited by an independent accountant.
