
Of the “known known” risks in financial markets today, we view tightening monetary policy as one of the top concerns, if not the top concern. Recently, inflation-related fears have catapulted to the top of investors’ minds, but tightening monetary policy, which is the primary tool to fight inflation, is the real risk for asset prices. Amidst the COVID-19 pandemic, the U.S. Federal Reserve Bank (“the Fed”) created an accommodative monetary policy environment by cutting short-term interest rates to zero and expanding the size and scope of its asset purchase plans (a.k.a. quantitative easing). If the economy or inflation reaccelerates, the Fed will likely need to shift to tightening monetary policy. During the most recent Fed meeting, the Fed acknowledged that inflation was becoming a bigger risk than previously expected and that they may increase short-term interest rates faster than previously expected. The big question for financial markets will be whether the underlying macroeconomic environment can support asset prices if the Fed moves away from an accomodative monetary policy.
Figure 1. U.S. Federal Reserve Interest Rate Hikes
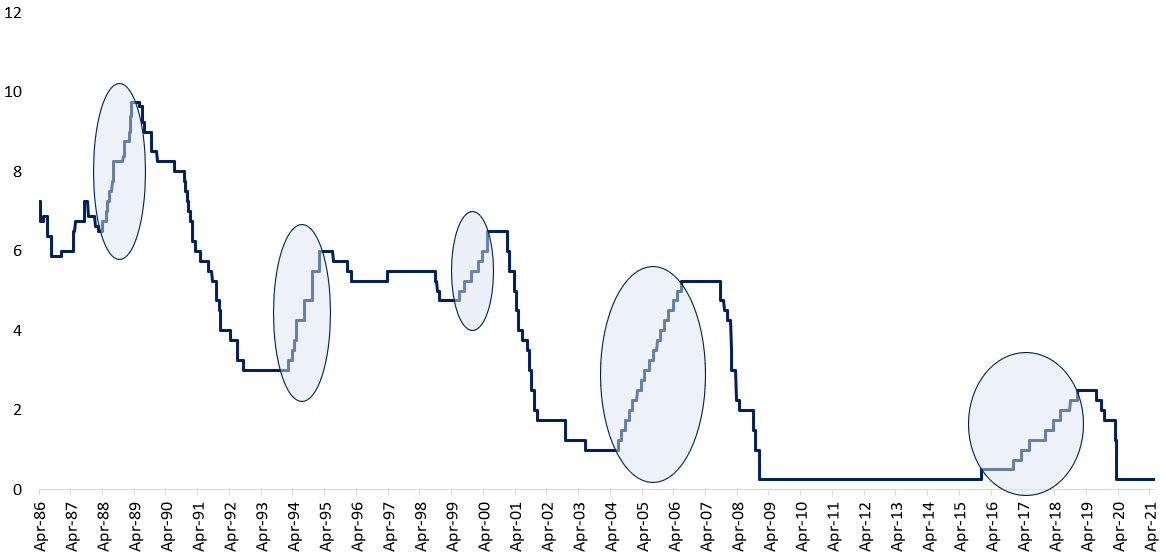
Source: Innealta Capital. Time frame 03/31/1986 to 05/31/2021. Shaded regions represent time periods of substained Fed Fund Rate increases.
The knee-jerk reaction to tightening monetary policy is to sell assets, particularly riskier assets, such as equities and commodities. Yet, if we review asset class performance during the past five periods of short-term interest rate hikes, shown in Figure 2, equities have performed exceptionally well. Developed Market equities exhibited an average annualized return between 8 to 10%, while Emerging Market equities exhibited an average annualized return of over 14%. Within fixed income, shorter-dated U.S. Treasuries tended to outperform longer-dated U.S. Treasuries. On average, commodities tended to outperform all other asset classes on an absolute basis. Today, fixed income yields are lower, and equity market valuations are higher than at the starting point of the five periods analyzed aboved. Low yields and elevated valuations represent significant headwinds to expected returns. Although history may repeat itself, we expect lower equity market fixed income market returns during the next tightening monetary policy environment than what has occurred over the five periods analyzed.
Figure 2. Multi-Asset Performance during FED Interest Rate Hiking Periods
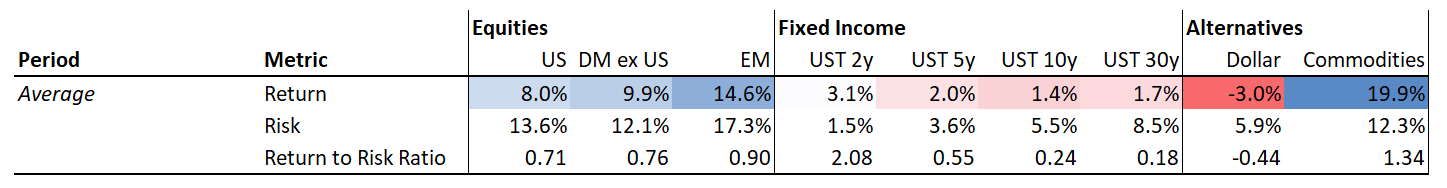
Source: Innealta Capital. Frequency monthly. Time frame 04/30/1987 to 01/31/2019. Note that EM equity data started on 12/31/1987. Returns were calculated on an annualized basis. Risk was calculated as the standard deviation of monthly returns. Return to Risk ratio refers to the Returns divided by the Risk. The “Average Return” and the “Average Return to Risk” refers to the simple average across the following time frames: Please see disclosures for category descriptions. Past performance is not indicative of future results. The five time frames under observation are 4/30/1987 – 12/31/1988, 1/31/1994 – 3/31/1995, 5/31/1999 – 6/30/2000, 5/31/2004 – 07/31/2006, and 11/30/2016 – 1/31/2019.
Over the past year, the U.S. economy has recovered tremendously, given the impact of the COVID-19 pandemic. If the FED were to begin hiking interest rates today, we feel that the current U.S. economy is stronger than the U.S. economy at the start of four of previous five FED rate hikes. Figure 3 shows that the Growth, Housing, and Consumer metrics generally screen better today. Employment data is mixed; however, we expect that the employment data will improve over the next few months. The significant difference today versus the other five time periods is inflation. The most recent Consumer Price Index announcement shows a +5.0% year-over-year change, a value significantly higher than CPI values at the start of the past five Fed rate hikes. In our opinion, some of the CPI change is due to base effects, while the inventory drawdowns have created inflationary pressures. On the one hand, the U.S. economy is currently very strong, while on the other hand, rising inflation is a relatively new behavioral dynamic for both the Fed and investors.
Figure 3. Macroeconomic Snapshot

Source: Innealta Capital. Time frame 04/30/1987 to 05/31/2021.
Of the past five Fed interest rate hiking periods, the period between April 1987 to December 1988 appears the most similar to today from a macroeconomic perspective. What is different about that time frame compared to today is the intentions of the Fed. In 1987 and in the spirit of the Louvre Accord, the Fed tightened monetary policy to halt a depreciating dollar. Today, rising inflation not declining dollar is the risk. Based on today’s macroeconomic environment, asset class historical performance, and current valuations, if the Fed were to begin raising short-term interest rates, we would expect the following:
- Fixed Income markets would provide low returns. This primarily caused by the low all-in yields currently available in the fixed income markets.
- Risky assets would provide higher absolute returns than fixed income markets; however, the risk-adjusted returns would be lower than the risk-adjusted returns over the past five years.
- Bond-to-equity market correlation experiences a sustained shift from negative correlation to positive correlation. In this positive correlation environment, fixed income does not act as a portfolio volatility dampener and many investors will need to rethink their portfolio construction.
This material is for informational purposes and is intended to be used for educational and illustrative purposes only. It is not designed to cover every aspect of the relevant markets and is not intended to be used as a general guide to investing or as a source of any specific investment recommendation. It is not intended as an offer or solicitation for the purchase or sale of any financial instrument, investment product or service. This material does not constitute investment advice, nor is it a substitute for such professional advice or services, nor should it be used as a basis for any decision or action that may affect your business. Before making any decision or taking any action that may affect your business, you should consult a qualified professional adviser. In preparing this material we have relied upon data supplied to us by third parties. The information has been compiled from sources believed to be reliable, but no representation or warranty, express or implied, is made by Innealta Capital, LLC as to its accuracy, completeness or correctness. Innealta Capital, LLC does not guarantee that the information supplied is accurate, complete, or timely, or make any warranties with regard to the results obtained from its use. Innealta Capital, LLC has no obligations to update any such information.
“U.S. Equities” refers to the S&P 500 Total Return Index, a diversified large cap U.S. index that holds companies across all eleven GICS sectors. “DM ex-U.S. Equities” refers to the MSCI EAFE Net Total Return Index, is an equity index which captures large and mid cap representation across 21 Developed Markets countries including countries in Europe, Australasia and the Far East, excluding the U.S. and Canada. With 844 constituents, the index covers approximately 85% of the free float-adjusted market capitalization in each country. “EM Equities” refers the MSCI Emerging Market Net Total Return Index, which captures large and mid cap representation across 27 Emerging Markets (EM) countries. With 1,424 constituents, the index covers approximately 85% of the free float-adjusted market capitalization in each country. “Dollar” refers to the U.S. Dollar Index, which is a measure of the value of the United States dollar relative to a basket of foreign currencies. “Commodities” refers to the GSCI Commodity Total Return Index, is a composite index of commodities that measures the performance of the commodity market. “UST 2y” refers to the Bloomberg Barclays U.S. Treasury Bellwethers 2 Year Total Return Index. “UST 5y” refers to the Bloomberg Barclays U.S. Treasury Bellwethers 5 Year Total Return Index. “UST 10y” refers to the Bloomberg Barclays U.S. Treasury Bellwethers 10 Year Total Return Index. “UST 30y” refers to the Bloomberg Barclays U.S. Treasury Bellwethers 30 Year Total Return Index.
787-INN-06/23/2021
