
Executive Summary
Increased concerns about global growth slowing and downside risks from trade resulted in deteriorating macro-economic conditions in the first half of 2019. As a result of the prevailing financial conditions, the U.S. Federal Reserve signaled it is open to cutting interest rates to stimulate growth and sustain the current economic expansion.
The S&P 500 index produced a return of 17.35% in the first half of 2019, its best first half since 1997. In our view, the current year to date index returns in the U.S. are unlikely to continue at this rapid pace.
We continue to advocate a globally diversified, multi-factor, multi-asset ETF. Moreover, we strongly believe sticking with a long-term investing plan will increase the probability of accomplishing one’s financial goals.
U.S. Federal Reserve
At its June meeting, the U.S. Federal Reserve Chairman, Jerome Powell, announced that the committee would keep the U.S. federal funds rate target range steady at 2.25-2.50%. However, the Federal Reserve provided a strong indication that it is open to cutting interest rates in order to sustain the current economic expansion.
A significant number of the committee members now favor an interest rate cut of 50bps before year end. Seven members now see 50bps of rate cuts in 2019, one sees a 25bps rate cut, and eight members see interest rates on hold. That’s a significant shift from the March FOMC meeting where eleven members saw rates on hold this year.
In our view, the Federal Reserve is reacting to a weaker global growth environment, rising uncertainty about trade policy, and negative sentiment about the global economic outlook.
Yield Curve
The inversion of the U.S. yield curve is a topic that the financial media continues to caution followers. Historically, a negative yield curve implies investors expect future short-term rates to be lower as the Federal Reserve eases policy in response to a potential recession. According to J.P. Morgan Research, 7 out of the 8 U.S. yield curve inversions since 1960 were followed by a recession.
While the media has been focusing on the 3-month Treasury bill vs. 10-year Treasury inverted yield curve, not all parts of the U.S. interest rate yield curve are inverted. For instance, the 2-year vs. 10-year spread remains positive at 24.82bps as of June 28, 2019. In fact, the 2-year vs. 10-year spread has historically been more of a bellwether for predicting economic recessions and has been steadily steepening since the 4th quarter of 2018.
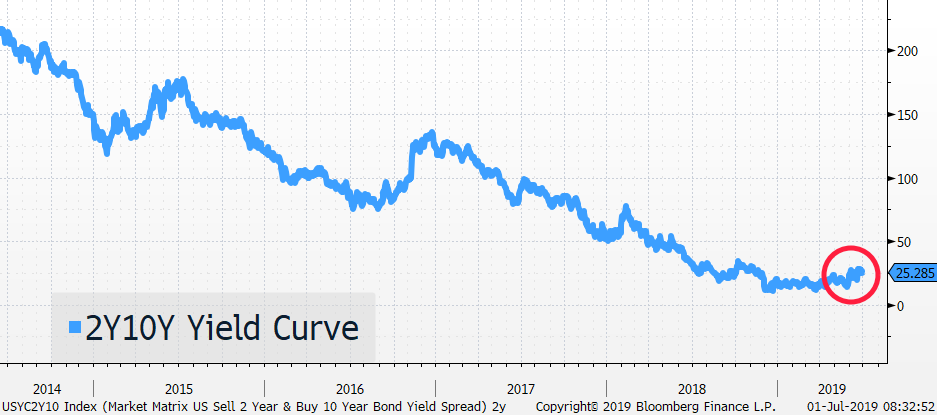
Source: Bloomberg, Astoria Portfolio Advisors
According to J.P. Morgan Research, the number of months between the 2-year vs. 10-year inversion and the subsequent recession has increased (17 months) for the prior 3 yield curve inversions compared to the prior four inversions (9 months). Moreover, J.P. Morgan’s Research group notes that there was a 22-month lag between the time the yield curve inverted in 2008 and the subsequent recession.
The NY Federal Reserve Bank maintains a Recession Probability Index for the next 12 months ahead. As of May 31, 2019, the NY Federal Reserve’s Recession Probability Index for 2020 stands at 29.62% (see chart below).

Source: Bloomberg, New York Federal Reserve, Astoria Portfolio Advisors
Tariffs
The G20 summit took place on June 28, 2019. The U.S. administration announced that it will hold off on 25% tariffs on the remaining US$300 billion U.S. imports from China. China announced that it would continue to purchase agricultural products from the U.S. Moreover, both countries announced it will roll back some non-tariff barriers such as restrictions on high-tech exports by U.S. companies.
The bad news is that uncertainty remains as there is no clear path towards a comprehensive resolution. From our perch, we believe that lingering uncertainty will continue to provide an overhang on the global economic outlook and trade and will lead a drag on global growth in the second half of 2019 and into 2020.
Economic Data, Valuations, and Portfolio Construction
Global economic data has deteriorated in 2019. The J.P. Morgan Global Manufacturing Purchase Managers Index, which is a measure of economic health for the manufacturing and service sector, has steadily declined since early 2018 (see chart below). A slowdown in various economies globally along with trade concerns have been the key drivers behind the weakness in manufacturing data.

Source: Bloomberg, J.P. Morgan, Astoria Portfolio Advisors
The U.S. economy isn’t immune to the global growth slowdown. The Atlanta Fed GDPNow Forecast Model is 1.50% as of June 28, 2019. On August 1, 2018, this model was forecasting GDP to be 4.95%.

Source: Bloomberg, Atlanta Federal Reserve Bank, Astoria Portfolio Advisors
Meanwhile, Morgan Stanley’s Business Conditions Index recently had its largest one-month decline since 2002 and is near its 2008 Great Financial Crisis level (see chart below).

U.S. stock valuations are neither cheap nor expensive. According to FactSet Research Systems, the S&P 500 Index forward P/E ratio is 16.6x as of June 28, 2019 and is slightly above the 5-year average (16.5x) and the 10-year average (14.8x).
From a long only ETF factor perspective, Quality, Size, and Momentum have outperformed the most thus far in 2019.

Source: ETFAction.com, Data accessed on June 28, 2019.
International Equities
On the back of the U.S. Federal Reserve’s more accommodative stance in the 1st quarter, International Developed and Emerging Markets equities posted strong returns in the 1st half of 2019. The Shanghai Stock Exchange Composite Index (China) increased by 20.96% (in CNY terms), the Euro STOXX 50 Index (Europe) rose by 19.81% (in Euro terms), the MSCI Emerging Markets Index was up 11.06% (in USD terms), and the Nikkei 225 Index (Japan) increased by 7.53% (in Japanese Yen terms).

Source: Bloomberg
The Bloomberg Dollar Spot Index (BBDXY) decreased by 0.75% in the 1st half of 2019.
According to ETFAction.com, the iShares MSCI ACWI ex U.S. ETF (ACWX) currently has a P/E ratio of 13.60x based on 2019 analyst estimates. This is significantly lower than the SPDR S&P 500 ETF (SPY) which has a P/E ratio of 17.47x based on 2019 analyst estimates.
In our view, Emerging Market equities (China in particular) remain attractive for long term investors as they are trading at a substantial valuation discount compared to the U.S. stock market. According to ETFAction.com, the iShares MSCI China ETF (MCHI) is projected to have 15.00% EPS growth based on 2019 analyst estimates whereas the S&P 500 ETF (SPY) is projected to have only 3.75%.
Fixed Income
U.S. interest rates declined across various maturities in the 1st quarter. Yields on the 2-year, 10-year, and 30-year U.S. Treasury Bonds were 1.75%, 2.01%, and 2.53% respectively as of June 28, 2019. Given that the U.S. yield curve is relatively flat, we believe ultra-short duration bond funds are providing investors with a more attractive opportunity compared to longer duration bond funds.
The Bloomberg Barclays U.S. Aggregate Bond Index is up 6.11% as of the end of the 1st half. We continue to prefer owning higher quality U.S. bonds across our portfolios. We maintain an overweight position in U.S. municipal bonds and U.S. mortgage-backed securities, both of which are highly rated. In fact, between 75-80% of our fixed income bonds across both Astoria’s strategic and dynamic ETF portfolios are rated either AAA or AA.
Commodities
Along with stocks and bonds, commodities posted positive returns in the 1st half. The Bloomberg Commodity Index increased by 3.83% although, once again, there were notable divergences across the complex. The United States Oil ETF (USO) increased by 24.64%, Invesco the SPDR Gold ETF (GLD) rose by 9.86%, DB Base Metals ETF (DBB) climbed by 0.71%, and the Invesco DB Agriculture ETF (DBA) declined by 2.18%.

Source: Bloomberg
We do not think rising inflation is a major risk for the economy. This is in fact a key reason why the U.S. Federal Reserve stopped raising interest rates. We are closely monitoring the New York Federal Reserve Underlying Inflation Gauge Index which has steadily declined since June 2018 (see chart below).

Source: Federal Reserve Bank of NY, Bloomberg, Astoria Portfolio Advisors
We have written that gold was attractive in a multi-asset portfolio as it serves as a valuable diversifier during times of stress. As a reminder, our gold allocation helped soften our portfolio volatility in the 4th quarter of 2018 as gold rose 7.53% while the S&P 500 Index declined 13.52%.
Market Timing
Our long-standing view is that timing the market top and bottom is extremely difficult and that investors are incentivized to stay fully invested. The past 3 quarters have proved our point. The S&P 500 Index declined 13.52% in the 4th quarter of 2018 and then rallied 17.35% in the 1st half of 2019. We continue to advocate not only to stay fully invested but to maintain a globally diversified, multi-asset portfolio.
Best, John Davi
Founder & CIO of Astoria
Warranties & Disclaimers
There are no warranties implied. Astoria Portfolio Advisors LLC is a registered investment adviser located in New York. Astoria Portfolio Advisors LLC may only transact business in those states in which it is registered or qualifies for an exemption or exclusion from registration requirements. Astoria Portfolio Advisors LLC’s web site is limited to the dissemination of general information pertaining to its advisory services, together with access to additional investment related information, publications, and links. Accordingly, the publication of Astoria Portfolio Advisors LLC’s web site on the Internet should not be construed by any consumer and/or prospective client as Astoria Portfolio Advisors LLC’s solicitation to effect, or attempt to effect transactions in securities, or the rendering of personalized investment advice for compensation, over the Internet. Any subsequent, direct communication by Astoria Portfolio Advisors LLC with a prospective client shall be conducted by a representative that is either registered or qualifies for an exemption or exclusion from registration in the state where the prospective client resides.
For information pertaining to the registration status of Astoria Portfolio Advisors LLC, please contact the state securities regulators for those states in which Astoria Portfolio Advisors LLC maintains a registration filing. A copy of Astoria Portfolio Advisors LLC’s current written disclosure statement discussing Astoria Portfolio Advisors LLC’s business operations, services, and fees is available at the SEC’s investment adviser public information website – www.adviserinfo.sec.gov or from Astoria Portfolio Advisors LLC upon written request. Astoria Portfolio Advisors LLC does not make any representations or warranties as to the accuracy, timeliness, suitability, completeness, or relevance of any information prepared by any unaffiliated third party, whether linked to Astoria Portfolio Advisors LLC’s web site or incorporated herein and takes no responsibility therefor. All such information is provided solely for convenience purposes only and all users thereof should be guided accordingly. This website and information presented is for educational purposes only and does not intend to make an offer or solicitation for the sale or purchase of any specific securities, investments, or investment strategies. Investments involve risk and unless otherwise stated, are not guaranteed. Be sure to first consult with a qualified financial adviser and/or tax professional before implementing any strategy. This website and information are not intended to provide investment, tax, or legal advice.
Past performance is not indicative of future performance. Indices are typically not available for direct investment, are unmanaged, and do not incur fees or expenses. This information contained herein has been prepared by Astoria Portfolio Advisors LLC on the basis of publicly available information, internally developed data and other third-party sources believed to be reliable. Astoria Portfolio Advisors LLC has not sought to independently verify information obtained from public and third-party sources and makes no representations or warranties as to accuracy, completeness or reliability of such information. All opinions and views constitute judgments as of the date of writing without regard to the date on which the reader may receive or access the information and are subject to change at any time without notice and with no obligation to update. Any ETF Holdings shown are for illustrative purposes only and are subject to change at any time. This material is for informational and illustrative purposes only and is intended solely for the information of those to whom it is distributed by Astoria Portfolio Advisors LLC. No part of this material may be reproduced or retransmitted in any manner without the prior written permission of Astoria Portfolio Advisors LLC. Investing entails risks, including possible loss or some or all of the investor’s principal. The investment views and market opinions/analyses expressed herein may not reflect those of Astoria Portfolio Advisors LLC as a whole and different views may be expressed based on different investment styles, objectives, views or philosophies. To the extent that these materials contain statements about the future, such statements are forward looking and subject to a number of risks and uncertainties.
