Recent economic reports suggest that the blistering pace of growth is easing, and inflationary conditions are cooling. However, over the next 12-18 months both measures should remain above levels consistently seen during the last business cycle.
The fundamentals of the U.S. economy have not changed much from the previous business cycle. Over time, the real, inflation-adjusted economic growth rate for the current cycle should be similar to the previous cycle. However, the economy is still carrying a lot of momentum as it recovers from the pandemic and the reopening continues despite challenges posed by the Delta variant. For example, the latest Purchasing Manager Index (PMI) data suggests economic momentum is persistently stronger than the levels we saw during the last business cycle.
Our economic growth expectation would be even higher if not for supply chain bottlenecks in everything from microchips to labor. We can see the effects of these supply chain bottlenecks in the latest Purchasing Manager Index (PMI) data that show the pace of growth slipping. Still, the slower pace of economic growth we may see going forward is very strong relative to the last business cycle. Over time, we expect the current momentum to ebb, but growth should remain strong over the near-term.
Similar to the peak we are seeing in the rate of real GDP growth, we think that we have likely seen the peak in the rate of inflation. However, this does not mean that inflation will quickly decline to the low levels that we saw during the previous business cycle. Rather, we expect inflation to persist at a rate well above the rate we experienced during the 2010-2019 period.
One of the major differences in the current environment is the massive amount of fiscal and monetary stimulus in this business cycle that dwarfs the previous business cycle. We think this massive amount of stimulus, along with other factors, will likely keep the rate of inflation higher than the previous business cycle on average. Though some “transitory” inflationary pressures, such as the rate of increase in used cars, may be easing, other longer-term pressures, such as wages and rents, are just beginning to build. We can see one example of this massive monetary stimulus in the growth rate of the money supply, or liquidity, in the financial system. As the following graph illustrates, the rate of liquidity growth in the system is far above anything we saw during the previous business cycle.
This view is consistent with what market-based inflation expectations are showing. For example, the 5-Year Treasury Inflation Protected Securities (TIPS) breakeven spread suggests that we will see an average of 2.55% inflation for the next 5 years. This is well above levels we saw consistently during the previous business cycle.
Given the pace of the U.S. Federal Reserve’s stimulus and the current supply chain and labor market disruptions we have experienced since the pandemic lockdowns, we expect much of this inflation to be frontloaded and it may take years to settle down and work through the system.
As a result of this continued economic growth, corporate revenue and earnings growth should remain strong while long-term interest rates are likely to move higher as the all-time low in real, inflation-adjusted, interest rates reverse. We have positioned our Strategies to benefit from these trends while managing the associated risks. Our current positioning favors value-oriented equity sectors, such as health care, financials, consumer staples, and dividend payers more broadly. On the fixed income side, we continue to emphasize high-quality, less interest rate sensitive investments that generate a relatively attractive current income.
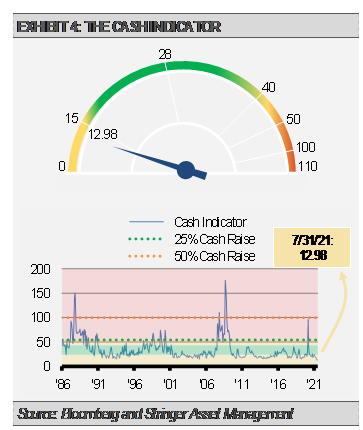
THE CASH INDICATOR
The Cash Indicator (CI) has been useful for helping us judge potential volatility. The CI remains near the low end of its normal range. Historically, this suggests that markets are overly complacent and not discounting risk. We think that this complacency makes financial markets vulnerable to shocks and could lead to a selloff. However, with economic fundamentals strong and abundant liquidity reserves in the system, we think that a market decline is likely a buying opportunity.
DISCLOSURES
Any forecasts, figures, opinions or investment techniques and strategies explained are Stringer Asset Management, LLC’s as of the date of publication. They are considered to be accurate at the time of writing, but no warranty of accuracy is given and no liability in respect to error or omission is accepted. They are subject to change without reference or notification. The views contained herein are not to be taken as advice or a recommendation to buy or sell any investment and the material should not be relied upon as containing sufficient information to support an investment decision. It should be noted that the value of investments and the income from them may fluctuate in accordance with market conditions and taxation agreements and investors may not get back the full amount invested.
Past performance and yield may not be a reliable guide to future performance. Current performance may be higher or lower than the performance quoted.
The securities identified and described may not represent all of the securities purchased, sold or recommended for client accounts. The reader should not assume that an investment in the securities identified was or will be profitable.
Data is provided by various sources and prepared by Stringer Asset Management, LLC and has not been verified or audited by an independent accountant.


