
By Arthur Huprich, CMT
SUMMARY
Following the recent short-term reversal from down to up by the S&P 500, the “quality follow-through” I said was critical last week never occurred. Thus, “down they came.” Until Selling pressure is exhausted and demand returns, the odds favor downward pressure on the equity market.
DOWNSIDE VOLATILITY
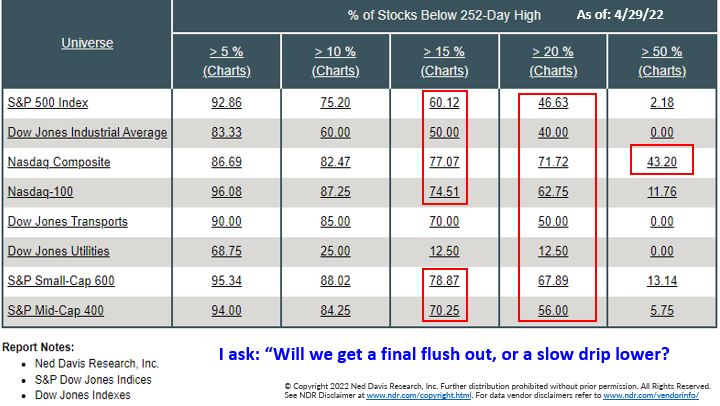
Volatility, as defined by the Volatility Index (VIX), has shown up for the third time this year (Figure 1—red arrows). Without rehashing why (please reach out if you would like to discuss it with the team), this has depicted a risk-off mentality—reduce/sell equity holdings. According to JPM, “April was one of the worst months in more than a decade across all asset classes… the S&P posting a loss of 2.8% on Tuesday, a 2.5% gain on Thursday, and 3.6% drop on Friday, which culminated in an 8.8% drop for the month of April, the index’s worst April since 1970, while the NASDAQ 100’s drop of 13.4% was its biggest since 2008.” Figure 2 offers another way to visualize the carnage (selling) Wall Street has experienced since mid-late 2021.
Figure 1: Volatility Index (VIX). YTD chart | Volatility, something we have anticipated and discussed since late 2021, has remained stubbornly persistent. Until the equity market fully absorbs and contains (discounts) these issues, I expect more of the same, in both directions!
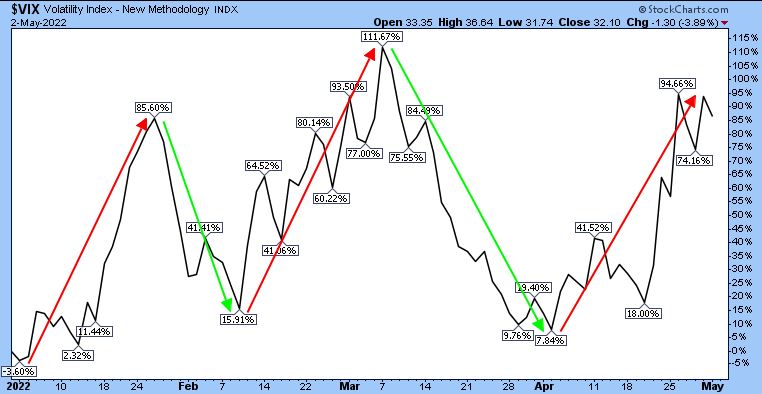
Figure 2: % of Stocks Below 252-Day High. As of 4/29/22 | Under the surface, the damage is obvious. Wall Street is now seeing what happens when this type of damage starts affecting the indices. As a friend is fond of saying, “Nothing like price to change sentiment,” especially relative to incoming phone calls and emails.
LOWER PRICE PEAKS AND LOWER PRICE TROUGHS EXTEND
Considering the statistics cited in the first paragraph, since April is historically a strong month for equities, I reflect on something Edson Gould, an influential stock market forecaster, once said: “If the market does not rally as it should during bullish seasonal periods, it is a sign that other forces are stronger and that when the seasonal period ends those forces will have their say.”
Figure 3: S&P 500 Large Cap Index. | Horizontal red lines, of which there are many, highlight levels of overhanging selling pressure (resistance). While some near-term levels of support exist, I can’t dismiss a testing of support as depicted by the green horizontal lines.
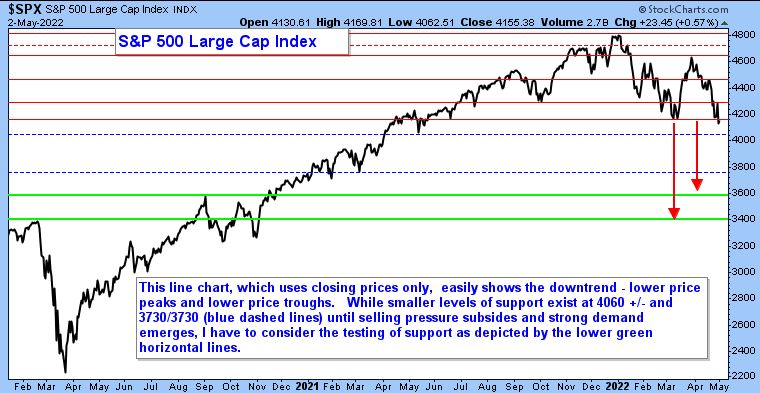
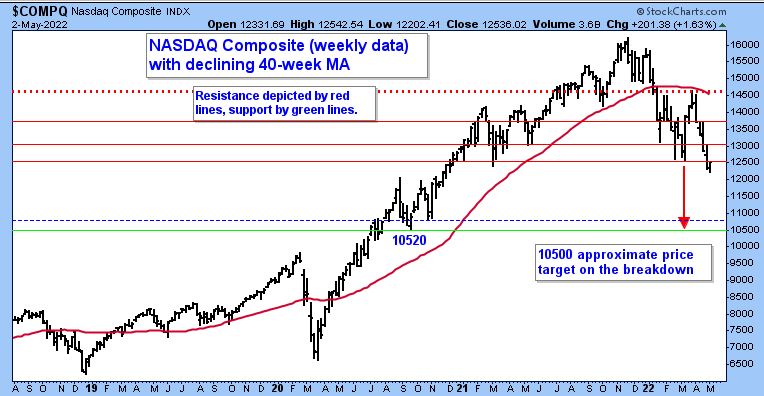
Figure 4: NASDAQ Composite. | The breakdown discussed last week occurred. Given the extreme decline recently, NASDAQ could experience some sharp countertrend rallies at any point. However, it will still need to contend with many levels of overhanging selling pressure (resistance), highlighted by the red horizontal lines.
SHORT-TERM
The SPX is oversold short-term and close on an intermediate-term basis—Figure 5. When combined with bearish sentiment approaching an extreme (Figure 6), the possibility of a sharp snapback move higher over the next few days/weeks exists! But for now, with a declining 200-day MA, it would be within the context of a downtrend. Please act accordingly.
Figure 5: S&P 500 Large Cap Index and % Stocks > 50-day MA and > 20-day EMA. | Oversold short-term (lower frame) but not quite there in the intermediate term (middle frame).
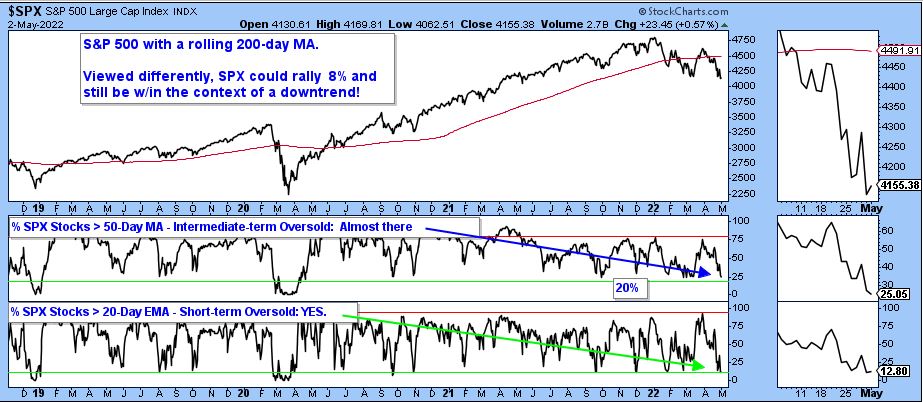
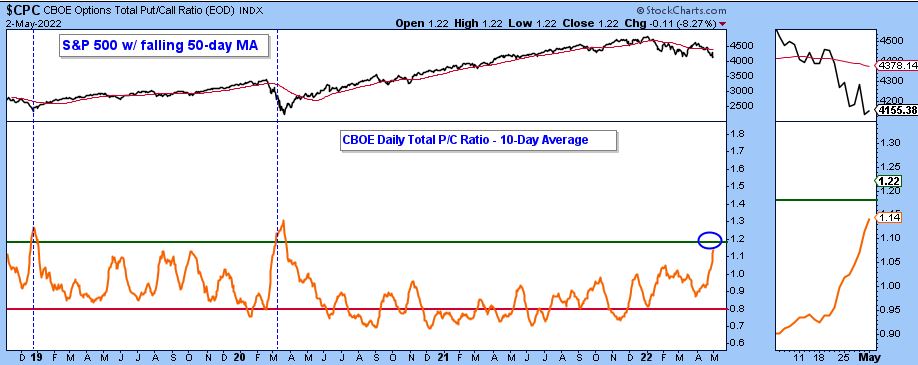
Figure 6: S&P 500 Large Cap Index and CBOE Total Daily Put/Call Ratio & 10-day average. | Bearish sentiment is approaching an extreme, which as a contrary indicator (extreme bearishness can be supportive of equities once a catalyst for higher prices occurs) is a step in the right direction.
Day Hagan Asset Management appreciates being part of your business, either through our research efforts or investment strategies. Please let us know how we can further support you.
—Written 05.02.2022. Chart source: Stockcharts.com unless otherwise noted.
For more news, information, and strategy, visit the ETF Strategist Channel.
Disclosure: The data and analysis contained herein are provided “as is” and without warranty of any kind, either express or implied. Day Hagan Asset Management (DHAM), any of its affiliates or employees, or any third-party data provider, shall not have any liability for any loss sustained by anyone who has relied on the information contained in any Day Hagan Asset Management literature or marketing materials. All opinions expressed herein are subject to change without notice, and you should always obtain current information and perform due diligence before investing. DHAM accounts that DHAM, or its affiliated companies manage, or their respective shareholders, directors, officers and/or employees, may have long or short positions in the securities discussed herein and may purchase or sell such securities without notice. The securities mentioned in this document may not be eligible for sale in some states or countries, nor be suitable for all types of investors; their value and income they produce may fluctuate and/or be adversely affected by exchange rates, interest rates or other factors.
Investment advisory services offered through Donald L. Hagan, LLC, a SEC registered investment advisory firm. Accounts held at Raymond James and Associates, Inc. (member NYSE, SIPC) and Charles Schwab & Co., Inc. (member FINRA, SIPC). Day Hagan Asset Management is a dba of Donald L. Hagan, LLC.
