
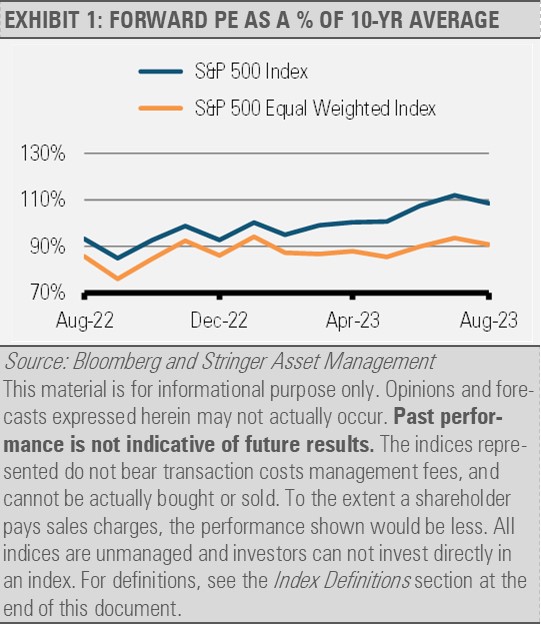
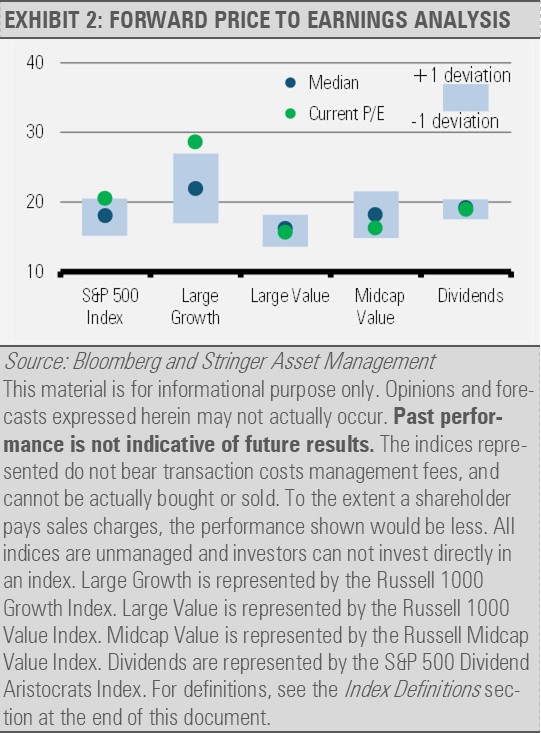
There has been a lot of talk about this year’s narrow equity market rally. What is less discussed is how the narrow rally has left many other areas of the financial markets extremely attractive. We are finding interesting investment opportunities almost everywhere we look across the equity landscape. For example, the S&P 500 Index, which weights each constituent stock by market capitalization, is trading at about a 10% premium to its 10-year average forward price-to-earnings (PE) ratio. This stretched valuation has been driven by a handful of top performing stocks. However, the expected earnings over the next 12 months for these stocks have not moved appreciably higher. As a result, these few stocks have become very expensive on a forward PE basis. Taking the same S&P 500 Index but equally weighing them instead of capitalization weighing them swings the valuation from a 10% premium to a 10% discount to its 10-year average forward PE.
Investment Implications
These kinds of performance chasing and speculative environments occur occasionally, and while the timing of these runs may differ, the result has always been the same. History and experience teach us that paying up to invest in areas that have already had a strong run, especially those that are trading at speculative levels, can be harmful to long-term financial goals.
We are also uncovering a bounty of opportunities in the traditional and non-traditional fixed income areas. Higher short-term interest rates have made short-term fixed income attractive, but we also want to allocate to intermediate and longer-duration fixed income to reduce the reinvestment risk down the road. If interest rates fall in the coming months and years, those investors holding intermediate- and longer-duration fixed income securities will benefit by locking in today’s higher interest rates as well as from the potential capital appreciation as intermediate- and longer-term bond prices could rise significantly in a falling interest rate environment.
Recent quickly changing dynamics in the fixed-income markets have created a host of opportunities to generate high-quality yield from a broad array of sources.
Rising interest rates and expectations for increasing Treasury bond issuance have made diversified sources of income more attractive. By broadening our sources of income, we have increased our current income and reduced sector specific risk. For example, we recently increased our exposure to sectors outside of the mainstream, such as non-agency mortgage-backed securities and collateralized loan obligations. We also have added a cash alternative that generates attractive yield.
Actively managing the fixed income allocation in addition to the equity allocation may help investors navigate this period of continued interest rate uncertainty and shifting fundamentals by tactically adjusting duration while gaining non-traditional bond exposures to harvest diversification benefits.
Meanwhile, our Recession Tracker continues to reflect healthy trends in jobs creation and real personal income excluding transfers. However, we remain cautious as our work suggests that the U.S. economy has gotten closer to a recession over the past year. Recent economic growth suggests that current GDP may come in above average, but leading indicators imply weakness ahead.
![]()
Still, the unemployment rate and real personal income remain within acceptable ranges. Accordingly, our model is not signaling that we are in a recession. However, given the increased likelihood of economic and market challenges ahead, we think that investors should take defensive steps to help protect their portfolios from downside risks.
By digging into the data, investors can uncover many opportunities to generate attractive returns while managing risks in real time. Our Three Layers of Risk Management process helps us identify strategic long-term attractive investments as well as tactical opportunities while maintaining a plan in case of an emergency.
Cash Indicator
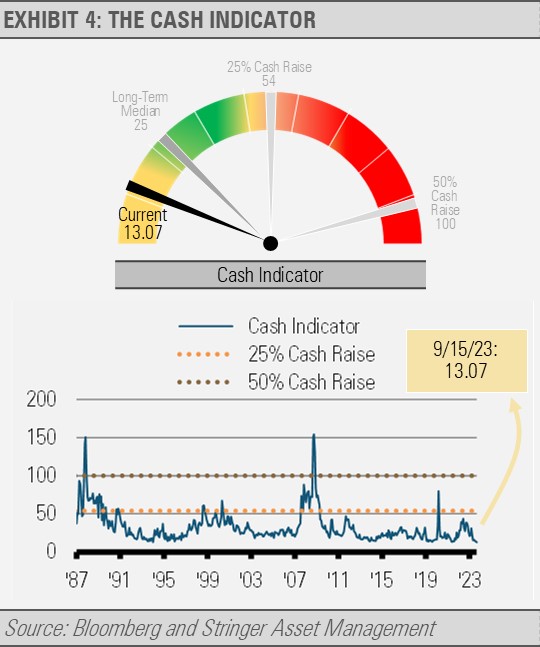
The Cash Indicator (CI) remains below its long-term median. At this level, the CI suggests that the markets may be overly complacent. When we have seen the CI at similarly low levels in the past, it was just a matter of time before the financial markets were surprised by some unexpected risk manifesting in the economy and markets. As a result, we emphasize the importance of patience and caution. While our longer-term economic outlook for the U.S. is very optimistic, we think that investors are not currently being compensated for taking significant investment risks at this time.
DISCLOSURES
Any forecasts, figures, opinions or investment techniques and strategies explained are Stringer Asset Management, LLC’s as of the date of publication. They are considered to be accurate at the time of writing, but no warranty of accuracy is given and no liability in respect to error or omission is accepted. They are subject to change without reference or notification. The views contained herein are not to be taken as advice or a recommendation to buy or sell any investment and the material should not be relied upon as containing sufficient information to support an investment decision. It should be noted that the value of investments and the income from them may fluctuate in accordance with market conditions and taxation agreements and investors may not get back the full amount invested.
Past performance and yield may not be a reliable guide to future performance. Current performance may be higher or lower than the performance quoted.
The securities identified and described may not represent all of the securities purchased, sold or recommended for client accounts. The reader should not assume that an investment in the securities identified was or will be profitable.
Data is provided by various sources and prepared by Stringer Asset Management, LLC and has not been verified or audited by an independent accountant.
Index Definitions:
S&P 500 Index – This Index is a capitalization-weighted index of 500 stocks. The Index is designed to measure performance of a broad domestic economy through changes in the aggregate market value of 500 stocks representing all major industries.
Russell 1000 Growth Index – This Index measures the performance of the large cap growth segment of the U.S. equity universe. It includes those Russell 1000 companies with relatively higher price-to-book ratios, higher I/B/E/S forecast medium term growth and higher sales per share historical growth. The Index is constructed to provide a comprehensive and unbiased barometer for the large-cap growth segment. The Index is completely reconstituted annually to ensure new and growing equities are included and that the represented companies continue to reflect growth characteristics.
Russell 1000 Value Index – This Index measures the performance of the large cap value segment of the U.S. equity universe. It includes those Russell 1000 companies with relatively lower price-to-book ratios, lower I/B/E/S forecast medium term growth and lower sales per share historical growth. The Index is constructed to provide a comprehensive and unbiased barometer for the large-cap value segment. The Index is completely reconstituted annually to ensure new and growing equities are included and that the represented companies continue to reflect value characteristics.
Russell Midcap Value Index – This Index measures the performance of the midcap value segment of the U.S. equity universe. It includes those Russell Midcap Index companies with relatively lower price-to-book ratios, lower I/B/E/S forecast medium term growth and lower sales per share historical growth. The Index is constructed to provide a comprehensive and unbiased barometer of the mid-cap value market. The Index is completely reconstituted annually to ensure larger stocks do not distort the performance and characteristics of the true midcap value market.
S&P 500 Dividend Aristocrats Index – This Index tracks companies within the S&P 500 Index that have a record of raising their dividends for at least 25 consecutive years. Each company is equally weighted within the Index. S&P will remove companies from the Index when they fail to increase dividend payments from the previous year. The Index’s universe includes stocks with a float-adjusted market capitalization of at least $3 billion and an average daily trading volume of at least $5 million, in addition to consistently increasing dividend payments. The index requires a minimum of 40 companies.
S&P 500 Equal Weight Index – This Index is the equal-weight version of the widely-used S&P 500 Index. The Index includes the same constituents as the capitalization weighted S&P 500 Index, but each company in the Equal Weight Index is allocated a fixed weight – or +0.2% of the index total at each quarterly rebalance.
For more news, information, and analysis, visit the ETF Strategist Channel.
