
By Nottingham Advisors Asset Management
Economic Overview
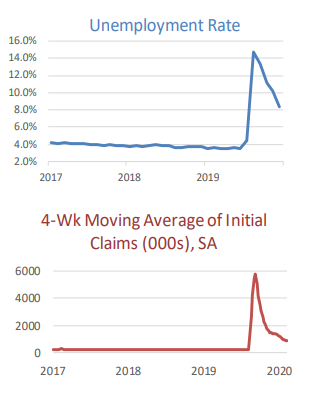
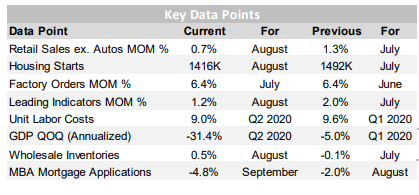
The latest reading for Q2 GDP showed a -31.4% annualized decline in economic activity during the quarter. With the close of the third quarter upon us, the New York Fed Nowcast report suggests a +14.1% rebound in Q3, while the Atlanta Fed GDPNow forecast estimates a more robust +32.0% surge in goods and services. This would be more suggestive of a traditional V-shaped recovery, a topic currently being debated among politicians as we head into the November elections.
The Unemployment Rate for August dipped to 8.4%, topping estimates of 9.8%, as 1.4 million jobs were recovered. Average Hourly Earnings edged up +0.4% MoM and +4.7% YoY, while Average Weekly Hours came in at 34.6. The JOLTS Job Openings number for July rose to 6.6 million and weekly Initial Jobless Claims for August averaged 863k.
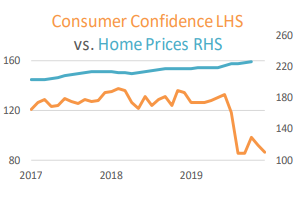
Housing remained a bright spot in many areas of the country – major urban centers being the exception – as people looked to the suburbs for relief from population density of large cities. New Home Sales rose +4.8% MoM in August, while Existing Home Sales met expectations at +2.4% MoM and Pending Home Sales surged +8.8% MoM (and a solid +20.5% YoY). The S&P CoreLogic CS US Home Price Index was up +4.8% YoY through July.
From here, the economic future of the US will be largely dependent on whether Congress passes further stimulus. The $2.2 trillion CARES Act kept people and companies afloat during the early days of Covid and now those benefits are waning. We’re seeing pickups in layoffs and furloughs at many companies in the travel and leisure space, including theme parks, airlines, hospitality and sports.
The Fed remains committed to low interest rates until at least 2023 and is willing to let inflation run hot should we see a pickup in economic activity. Inflation hedges remain inexpensive as the supply of money in the US continues to grow.
Domestic Equity
US Equities lost ground in September, with the benchmark S&P 500 index falling -3.8% to close the month at 3,386. Despite September’s pullback, which saw an intra-month peak to trough decline of more than -10%, the
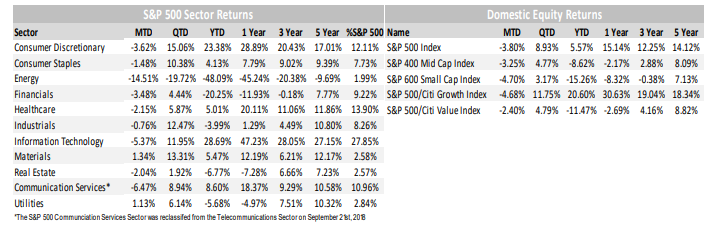
S&P 500 staged a quick rebound as investors bought the dip. Broad economic data continued to improve throughout the quarter, which helped buoy Large-Caps by +8.93% during the third quarter, propelling the benchmark up +5.57% year to date.
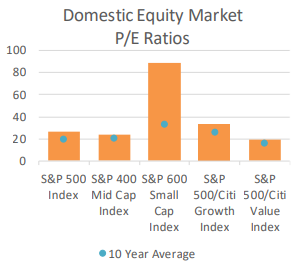
Mid- and Small-Caps also fell during September, with the S&P 400 and 600 Indices falling -3.25% and -4.70%, respectively. Both posted gains during the quarter, up +4.77% and 3.17% apiece, but remain firmly in the red year to date, down -8.62% and -15.25%, respectively, highlighting the disparity between Large- and Small-Caps and trepidation around nonFAAMG (Facebook, Apple, Amazon, Microsoft, Google) risk assets.
Growth stocks underperformed during the quarter, with the S&P 500 Growth Index falling -4.68%, compared to the S&P 500 Value Index which fell only -2.80% during the period as investors begin to contemplate the “re-opening trade” which may be more Value driven and economically sensitive. While this trade has shown signs of life before, previous months of Value outperformance have been head fakes; however, with Growth outperforming Value by more than 32 percentage points year to date (+20.61% vs. -11.90%), the case can clearly be made for a rotation out of what has worked into what has not.
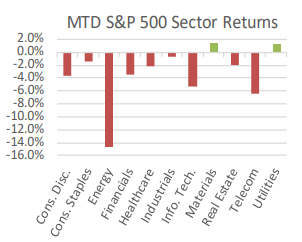
From a sector standpoint, only 2 of 11 sectors finished the month in positive territory, with Materials and Utilities posting gains of +1.34% and +1.13%, respectively. Of the remaining sectors in negative territory, Communication Services, Technology, and Consumer Discretionary posted losses of -6.47%, -5.34% and -3.62%, respectively. Technology and Consumer Discretionary remain the year’s best performers by a wide margin, up +28.69% and +23.38%. Other notable decliners included the Energy sector, which lost -14.51% on the month and has lost nearly half its value year to date. Energy now represents a negligible 2% of the S&P 500 Index, and after Exxon’s removal from the Dow Jones Industrial Average, represents the shift taking place to Growth oriented sectors and a transition to renewable energy sources.
International Equity
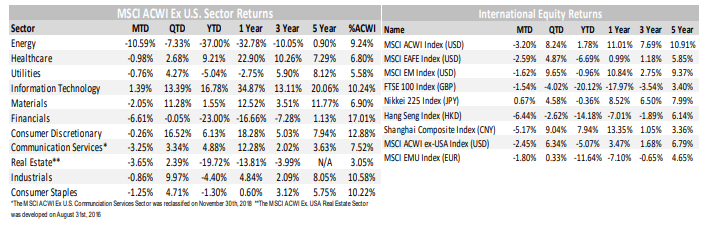
International Equities posted slight declines in September, with both Developed and Emerging Markets (EM)equities faring better than their US counterparts. Developed Markets (DM) as measured by the MSCI EAFE Index fell -2.59% on the month, while Emerging Markets, as measured by the MSCI EM Index, fell -1.62%. Despite DM and EM equities outperforming US equities on the month, their performance was mixed during the quarter. DM underperformed during the quarter, gaining only +4.87%, while EM outperformed gaining +9.65%. Both were helped by a weaker US Dollar – but, with Asian economic data improving at a rapid clip it shouldn’t come as a surprise that EM outperformed DM during the period. For the year, DM has lost -6.69%, while EM has lost only -0.96%, putting both DM and EM ahead of US Mid- and Small-Caps, but trailing the Large-Cap S&P 500 Index.

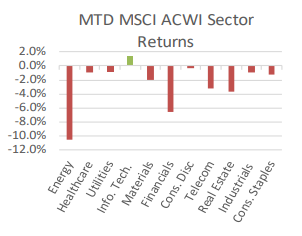
From a sector standpoint, only 1 of 11 sectors finished the month in positive territory, with the MSCI ACWI ex USA Technology sector gaining +1.39% during the period. Technology stocks outside the US continue to be top performers, with the sector up +16.78% year to date. Energy was the worst performing sector on the month, down -10.59%, and is down -37.00% for the year. Similar to the US market, Value stocks continue to underperform internationally; however, with Growth areas hard to come by in DM regions such as Europe, investors have turned their attention to Asia to focus on behemoths such as Tencent and Alibaba. Both companies dominate their respective markets, but have market caps that are dwarfed by their US equivalents, despite similar platform based business models. With the much anticipated initial public offering of Ant, and the recent inclusion of Alibaba in the Hang Seng (Hong Kong) Index, potential catalysts are abound for EM Technology to continue to attract investor interest.
From a regional standpoint, China and Japan continued their leadership amongst major international benchmarks. In Japan, the Nikkei 225 Index gained +0.67% in JPY terms on the month and has outperformed DM on a year to date basis returning -0.36%. China, as measured by the Shanghai Composite, lost -5.17% on the month in CNY terms, despite the Yuan’s appreciation versus the US Dollar. The Shanghai Composite was a top performer during the quarter, gaining +9.04%, and is an outperformer year to date gaining +7.94%.
Fixed Income
Over the past month, Treasury yields have been relatively stable, moving only a few basis points higher. In August, rates had also increased. Even after two consecutive months of rising Treasury yields, we remain over 100 basis points lower than where most maturities began the year, with only the 30 year Treasury having fallen slightly less than that.
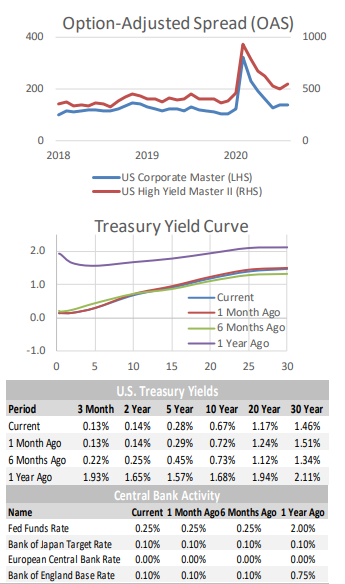
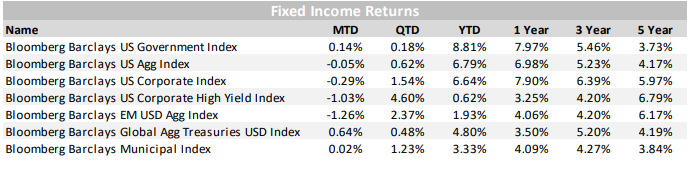
With interest rates having moved little in September, and credit spreads trending wider, Investment Grade and High Yield bonds gave back some of their recent gains, underperforming Government bonds and the broad index (US Agg). US Dollar strength worked against Emerging Market bond returns in September.
Municipal returns were flat in the month, and their relative value to Treasury bonds has been fairly stable since mid-year. Tax-free bonds have continued to see significant interest from investors and strong inflows into funds offering tax-advantaged income. This is likely not unrelated to the coming election.
The Federal Reserve would like to let inflation run higher than it has in the past, hoping to average 2% (meaning it would be allowed to run above 2% for a period of time, because the past decade it has run below 2%). The European Central Bank is considering following suit, with a “symmetric 2% inflation objective.” It was nice of them to phrase it differently, but the policy that they are considering is identical to the Fed’s “average inflation targeting” (AIT) of 2%.
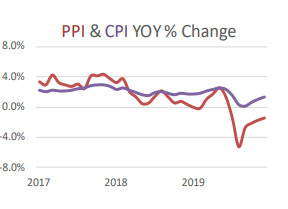
There are currently examples of frictional inflation due to having shut down production during the Covid lock-down, followed by demand recovering faster than supply (lumber prices are a good example). Broad based inflation typically presents itself when an economy is running hot and at full employment. Currently, we seem far from that scenario, but these are unusual times, which require diligent monitoring.
Alternative Investments
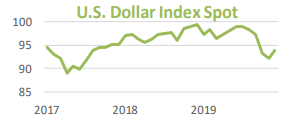
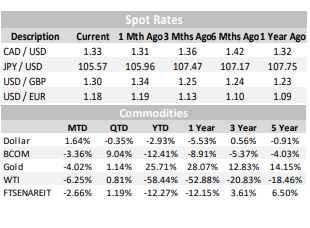
Alternative Investments were mostly negative in September, hampered by a risk off environment that saw global equity prices decline, as well as a stronger US Dollar. The US Dollar, as measured by the DXY Index gained +1.9% in September after declining each of the previous four months. The Dollar bounced back after falling -6.9% from its April highs, and remains down -5.2% over the past 6 months.
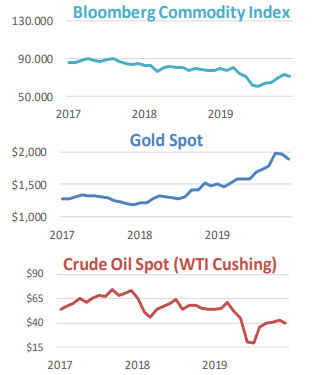
The Dollar’s strength put pressure on commodities broadly, as measured by the Bloomberg Commodities Index, which fell -3.4% on the month. West Texas Intermediate (WTI) crude oil fell -5.6%, or more than $2/barrel to close at $40/barrel on the NYMEX. Gold also declined in September, falling -4.2%, or $72/ounce, to close at $1,885/ounce. The shiny metal has been a beneficiary of low interest rates, a weak dollar, and falling real yields, which have pushed prices to new highs. Gold remains up +24.3% year to date, which puts it ahead of all major asset classes. With the Federal Reserve pledging to hold rates at zero for the intermediate term, as well as let inflation exceed its 2% target, Gold prices may have additional tailwinds moving forward.
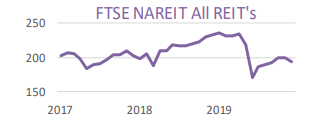
Real Estate, as measured by the FTSE NAREIT All REIT Index remained under pressure as well, falling -3.1% on the month. Real Estate remains down more than -17% from its January highs, and shows few signs of rebounding in the current environment.
Volatility, as measured by the CBOE VIX Index, was largely unchanged on the month, falling -0.15% to close at 26.37. Volatility has remained elevated as uncertainty around economic activity, a rise in coronavirus cases, future stimulus, and November’s election (amongst others) persists. The VIX index has risen more than +80% year to date, but remains well off its all-time high reached back in March.
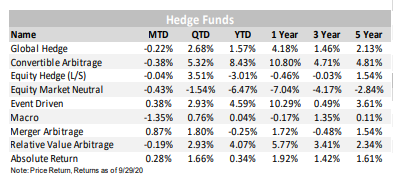
Hedge Fund strategies posted mixed results during the month, with three of nine strategies tracked posting positive returns on average. Merger Arbitrage was the top performer, up +0.87% on the month, while Macro strategies were the worst performer down -1.35% during the period. For the year, the range of outcomes between strategies continues to widen, with the best performer, Convertible Arbitrage up +8.43% and the worst performer, Equity Market Neutral down -6.47%, highlighting the disparity amongst strategies often grouped together as liquid alternatives.
ESG
This year’s September Climate Week brought the focus back on the environmental aspect of ESG. We saw corporate announcements for net-zero emission goals from AT&T, Walmart, Morgan Stanley, Google, Ford, Facebook and more. As support for ESG investing continues to grow, it will be important for companies to follow through on these initiatives over the coming decades to prove their commitment to ESG.
In addition to corporate pledges, on September 22nd, the World Economic Forum released a set of universal ESG measures and disclosures to help companies report nonfinancial disclosures centered on four pillars; people, planet, prosperity and principles of governance. This is a step toward making stakeholder capitalism measurable and continues to gain support from corporations; with some planning to start incorporating immediately.
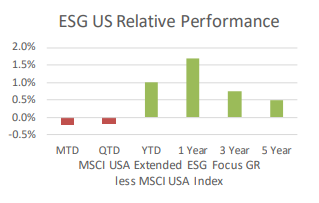
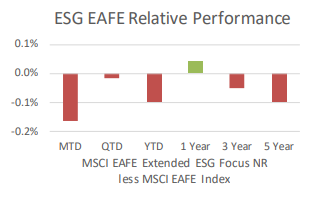
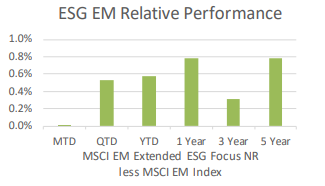
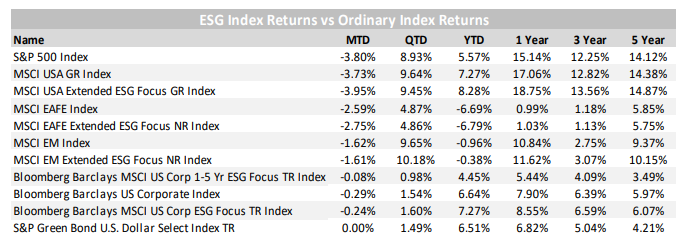
The MSCI USA Extended ESG Focus Index underperformed the MSCI USA Index by 22 bps for the month but still outperformed year to date by 102 bps. The MSCI EAFE ESG Focused Index returned 16 bps less than the MSCI EAFE Index for the month and has now underperformed by 10 bps YTD. Meanwhile, the MSCI EM ESG Focused Index outperformed on all time periods we track, up 1 bp for the month and 58 bps year to date.
The Bloomberg Barclays MSCI US Corp ESG Focus continues to perform well, up +7.27% for the year,
compared to the Bloomberg Barclays US Corporate Index which is up +6.64% YTD.
Nottingham Advisors, Inc. (“Nottingham”) is an SEC registered investment adviser with its principal place of business in the State of New York. Nottingham and its representatives are in compliance with the current registration requirements imposed upon registered investment advisers by those states in which Nottingham maintains clients. Nottingham may only transact business in those states in which it is registered, or qualifies for an exemption or exclusion from registration requirements. This material is limited to the dissemination of general information pertaining to Nottingham’s investment advisory/management services. Any subsequent, direct communication by Nottingham with a prospective client shall be conducted by a representative that is either registered or qualifies for an exemption or exclusion from registration in the state where the prospective client resides.
The information contained herein should not be construed as personalized investment advice. Past performance is no guarantee of future results. Information contained herein should not be considered as a solicitation to buy or sell any security. Investing in the stock market involves the risk of loss, including loss of principal invested, and may not be suitable for all investors. This material contains certain forward-looking statements which indicate future possibilities. Actual results may differ materially from the expectations portrayed in such forward-looking statements. As such, there is no guarantee that any views and opinions expressed in this letter will come to pass. Additionally, this material contains information derived from third party sources. Although we believe these sources to be reliable, we make no representations as to the accuracy of any information prepared by any unaffiliated third party incorporated herein, and take no responsibility therefore. All expressions of opinion reflect the judgment of the authors as of the date of publication and are subject to change without prior notice. Past performance is not an indication of future results.
The indices referenced in the Nottingham Monthly Market Wrap are unmanaged and cannot be invested in directly. The returns of these indices do not reflect any investment management fees or transaction expenses. Had these additional fees and expenses been reflected, the returns of these indices would have been lower. Information herein has been obtained from third party sources that are believed to be reliable; however, the accuracy of the data is not guaranteed by Nottingham Advisors. The content of this report is as current as of the date indicated and is subject to change without notice.
For information pertaining to the registration status of Nottingham, please contact Nottingham or refer to the Investment Adviser Public Disclosure web site (www.adviserinfo.sec.gov). For additional information about Nottingham, including fees and services, send for our disclosure statement as set forth on Form ADV from Nottingham using the contact information herein. Please read the disclosure statement carefully before you invest or send money.
