
Summary
The Ned Davis Research Catastrophic Stop Loss Model has been fully invested since November 2022. Compared to its S&P 500 benchmark, it has remained on the correct side of the trend. Barring a change by the model and with a new bullish Zweig Breadth Thrust and with credit spreads contained (reach out for a chart of either), if breadth improves further and we see a short-term overbought pullback, I wouldn’t be surprised by additional probing higher—a test of the February peak, for starters.
Twist and Shout
Well, shake it up, baby, now
Twist and shout
C’mon, c’mon, c’mon, c’mon, baby, now
Come on and work it on out
Well, work it on out, honey
You know you look so good
You know you got me goin’ now
Just like I knew you would
Twist and Shout, The Beatles, 1963
Who on Wall Street hasn’t been trying to “work it on out” or twisting and shouting both positively and negatively about the movement by the Large Cap Technology/Growth complex since the beginning of 2023? More recently, since the regional banking crisis (mini crisis?) in early March, the twisting and shouting (rotation) has gotten louder and sounds more like “Let’s pile into Large Cap Technology, as a cash-rich/strong cash flow safe haven.” Clearly this continuing rotation helped extend the “Growth over Value” relative strength trend. This relative strength trend is now long in the tooth (overbought short-term—more twisting and shouting) and something we will watch closely. One way I will watch the “Growth versus Value” narrative is by following the near-term relative strength trend of the Semiconductor Index versus NASDAQ and the price trend of the NYSE FANG+ Index—Figures 1 and 2.
That said, the resiliency of the S&P 500 to absorb and contain bad news and rally has been very impressive. Within that context, while breadth has improved in the short term, I want to see further improvement. In other words, rallies need to broaden out further—more stocks moving in sync higher. If this does not occur, the market would be vulnerable to a pullback or, as Ned Davis Research stated, “a mega cap downturn.”
Figure 1: Semiconductor Index versus NASDAQ – relative strength trend used to discern a change in the Growth over Value relative strength trend. | Please refer to the notes in the chart.

Figure 2: NYSE FANG+ Index – used to discern a change in the Growth over Value relative strength trend. | Please refer to the notes in the chart.

April Narrative: The Best Month?
Considering outside forces can overwhelm cycles and seasonal trends, according to the invaluable Stock Trader’s Almanac:
Typical pre-election year strength does bolster April’s performance since 1950. April is DJIA’s best month in pre-election years (+3.9%), second best for S&P 500 (+3.5%) and third best for NASDAQ (+3.6%). Small caps measured by the Russell 2000 also perform well (+2.9%) with gains in eight of eleven pre-election year April’s since 1979. S&P 500’s and NASDAQ’s single losing pre-election year April was in 1987.
Figure 3: S&P 500 – no indicators, just “price.” | Will the “Best Month” narrative be enough to get through resistance? With a new month and new quarter flows/potential rotation, it’s a toss-up. But the area between 4150+/- and 4200+/- ought to provide some resistance (selling pressure).
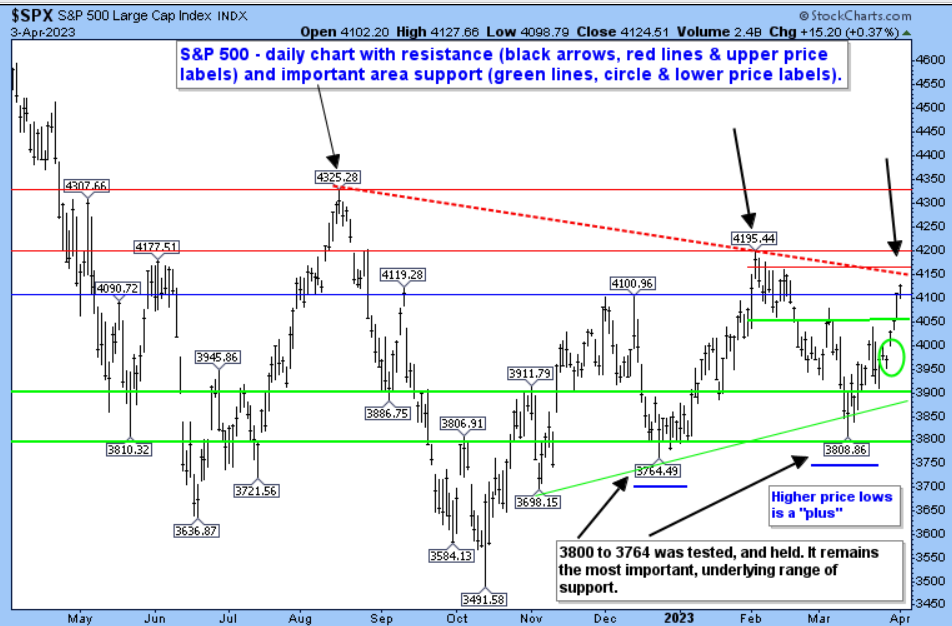
Note: NASDAQ, DJIA, and Small Cap proxy are all also right up against some resistance—potential selling pressure. Please reach out for a chart.
Additional Guidepost of Interest
Figure 4: KBW Bank Index. | Having discussed the necessary basing pattern in last week’s report, using the Regional Bank Index, here is the larger cap/larger company banking index. In regards to managing/hedging downside risk ahead of time, please see the notes in the chart.

The Day Hagan/Ned Davis Research Smart Sector strategies utilize measures of price, valuation, economic trends, monetary liquidity, and market sentiment to make objective, unemotional, rational decisions about how much capital to place at risk, as well as where to place that capital. Please reach out for specifics.
Day Hagan Asset Management appreciates being part of your business, either through our research efforts or investment strategies. Please let us know how we can further support you.
Art Huprich, CMT®
Chief Market Technician
Day Hagan Asset Management
—Written 4.02-03.2023. Chart and table source: Stockcharts.com unless otherwise noted.
For more news, information, and analysis, visit the ETF Strategist Channel.
Disclosure
The data and analysis contained herein are provided “as is” and without warranty of any kind, either express or implied. Day Hagan Asset Management (DHAM), any of its affiliates or employees, or any third-party data provider, shall not have any liability for any loss sustained by anyone who has relied on the information contained in any Day Hagan Asset Management literature or marketing materials. All opinions expressed herein are subject to change without notice, and you should always obtain current information and perform due diligence before investing. DHAM accounts that DHAM, or its affiliated companies manage, or their respective shareholders, directors, officers and/or employees, may have long or short positions in the securities discussed herein and may purchase or sell such securities without notice. The securities mentioned in this document may not be eligible for sale in some states or countries, nor be suitable for all types of investors; their value and income they produce may fluctuate and/or be adversely affected by exchange rates, interest rates or other factors.
Investment advisory services offered through Donald L. Hagan, LLC, a SEC registered investment advisory firm. Accounts held at Raymond James and Associates, Inc. (member NYSE, SIPC) and Charles Schwab & Co., Inc. (member FINRA, SIPC). Day Hagan Asset Management is a dba of Donald L. Hagan, LLC.
For more information, please contact us at:
Art Huprich, CMT
For more information, please contact us at:
Day Hagan Asset Management
1000 S. Tamiami Trl
Sarasota, FL 34236
Toll Free: (800) 594-7930
Office Phone: (941) 330-1702
Website: https://dayhagan.com or https://dhfunds.com
